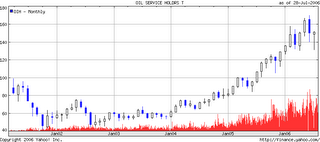
The Oil Service Sector
 Above is the Oil Service Sector ETF, OIH. I put this chart up for a specific reason. Jeff Saut, whom I view as one of the most trustworthy and savvy public figures on Wall Street has just been quoted on Bloomberg as still being an energy bull. Clicking on his name will take you to his regular commentary which I read when I get the chance. While I believe oil will eventually drop significantly or collapse, its appeal will likely not tarnish overnight. So, $10 oil isn't just around the corner. It might actually take years to collapse. But the oil stocks are a different story. So, what do you see on this chart? Anything unusual? Anything foreboding? Remember, patterns repeat. Patterns can be in equity markets or outcomes to certain economic cycles or your own behavior. Very few of us break the cycle of patterns in our own life so why would human behavior ever change? We use the past to divine the future because human behavior is the one constant in an ever changing world.
Later this week, I'll show you another view of OIH which will provide what I believe is alot of clarity.


<< Home