


Acute Cerebral Infarction And Your Typical Wall Street Expert - The Wisdom Of Herds, Brain Farts and Stock Market Sentiment
I'm sorry if I continually take pot shots at Wall Street. If you work on Wall Street, do not take offense. Somehow I am attracted to derogatory and cynical humor. It gives my life meaning when I can make fun of the elitist snobs who are above the crowd. Those who buy their $20 million Manhattan penthouse, a beach house in the Hamptons and new Aston Martin Vanquish when a child dies every three seconds in this world because of no health care or lack of sustenance. Those on Wall Street who draw in those seven, eight or even nine figure salaries because they are omniscient and enlightened. They truly have achieved prajna. Oh great one, Wall Street guru, please come before us on CNBC and share The Word with us lowly proletariat. Tell me should I buy, sell or hold? I wish I could express laughter in my text because some of you might think I'm serious. Although I am quite serious about my statement of humanity. Make you feel guilty? Then don't read my blog or make a donation to a children's charity. I don't have alot of respect for the generalized bullshit and pablum Wall Street feeds the average investor. Two things we are fed daily with a firehose.
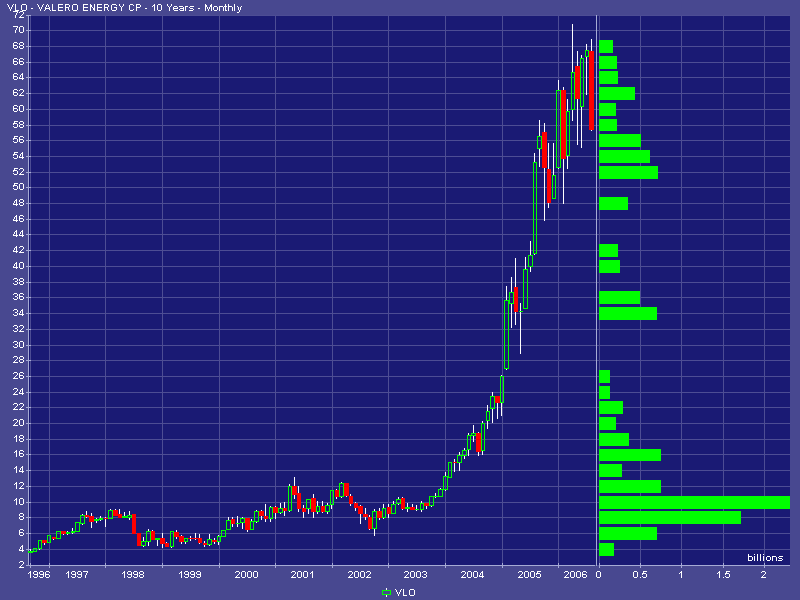
Ok, enough of my cynicism. Let's look at a few charts courtesy of your brilliant Wall Street professionals. I say courtesy of Wall Street because they are the people who bid these stocks up and are telling you to buy at these levels. A nouveau riche form of taking from the rich and giving to the poor. You know, like they did in 2000 right before the market dropped 85%. Caterpillar, Valero, Titanium Metals, Nucor, Manitowoc, Inco are all rising charts with higher highs and higher lows. These are companies that are printing cash on the China story, the peak oil theory, the global building boom. The charts of these stocks are monthly charts showing ten years of data. The horizontal bar charts on the right side of the price charts are monthly volume a the corresponding price. See a pattern? Indeed, a very disorderly rise. Massive gaps in volume. Those are danger signs. Irrational sentiment. "I can see it. 1.3 billion people in China and houses, roads, bridges, TVs and schools for all. I am going to be rich!" Stupid money or momentum money chasing stocks. Don't equate stupid with momentum. They can be mutually exclusive. Stupid is to hold when momentum fails. Riding momentum while it is strong is not stupid. That's called making money. If you believe in mean reversion after disorderly price increases, and you should because that is what happened to the Nasdaq post 2000, reversion happens around volume. Fibonacci retracements? Ah. Maybe some self fulfilling prophecy there. Retracement to areas of significant volume. Absolutely.
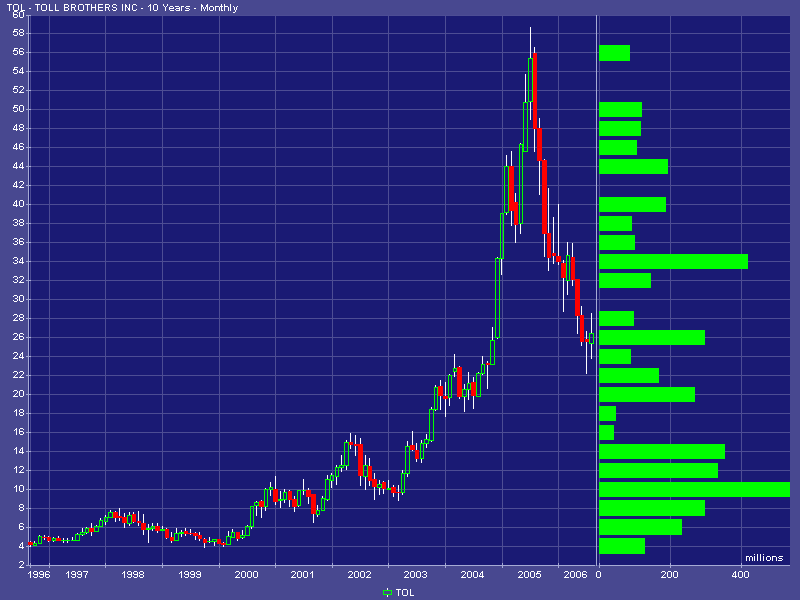
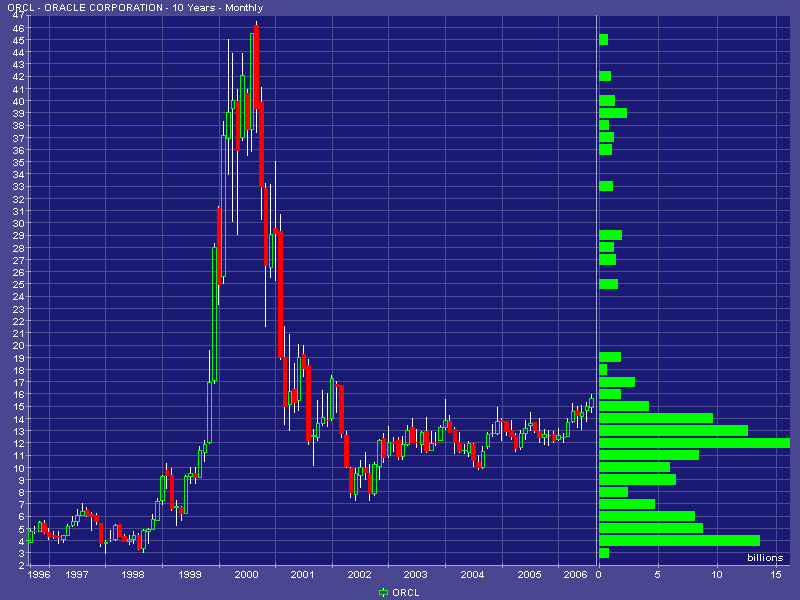
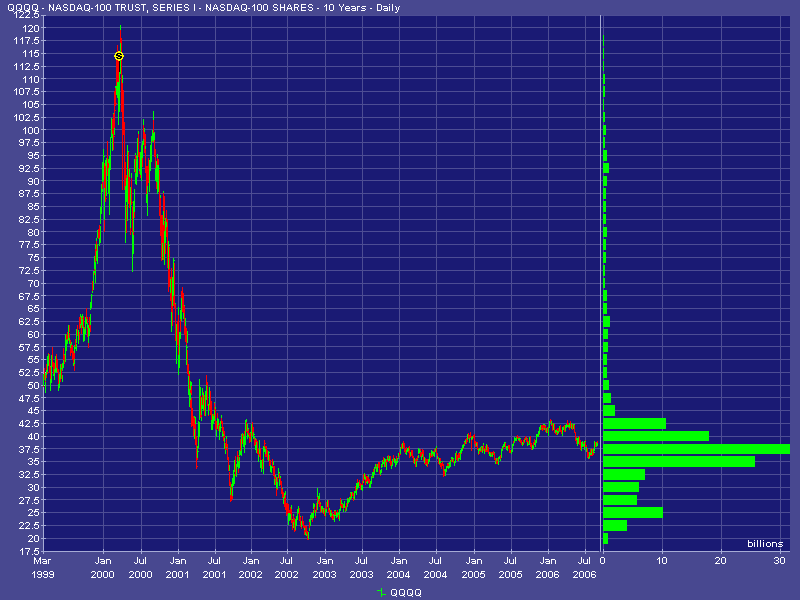
So, further down we've got a few additional charts of similar patterns which have progressed a little further into their cycle. Toll Brothers, Oracle and Intel. Toll Brothers is in the middle of a retracement. The Hovnanian CEO was recently on Bloomberg stating the downside risk to his company seemed minimal given it was trading at book value and used to trade at two times book value. Really? At two times book value, your stock was a bubble of the likes seldom seen. At book value, your stock is only overvalued by about 50% in my estimation. Remember, this is a CEO, along with all of the other homebuiding CEOs, who were on CNBC daily telling you how smart they were. To be fair, I'm sure they are quite capable at running their businesses but not at telling you when to buy or sell their stock. Oracle and Intel have had quite a few years to retrace. Isn't it odd that all charts started out looking the same way? Isn't it ironic that price and volume find a stasis over time? Finally, look at the daily chart of the Nasdaq 100 ETF, QQQQ. There isn't ten years of data behind it because it hasn't been available that long but looks like alot of virgin territory with respect to volume at higher prices doesn't it? If I printed monthly data there would also be gaps on this chart but I chose daily to give you a better view of where we are today with respect to the Nasdaq 100. Do you wonder why big money was dumping shares the first six months of this year?
So, I ask you again, is sentiment bullish or bearish? Has sentiment in these stocks been bullish or bearish? If sentiment surveys are bearish at a point where market leader charts look like this, do you want to be a contrarian? Is Wall Street about to leave main street holding the bag again? Being a contrarian isn't all it's cracked up to be. Being on the right side of the trade is.
This is a tool anyone can use. It's readily available via many investment services and many offer it free as part of their investment tools. Very few people know about it or know how to use it. That includes Wall Street professionals. It's very basic so it isn't because they aren't capable of using it. It's because they are too busy crawling through balance sheets trying to predict the future of corporate earnings with a Ouija board. Learn to use it and save yourself some money.
Click on the following charts for a larger view.
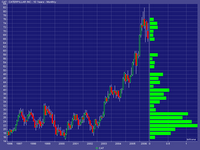


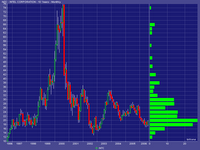

Ok, enough of my cynicism. Let's look at a few charts courtesy of your brilliant Wall Street professionals. I say courtesy of Wall Street because they are the people who bid these stocks up and are telling you to buy at these levels. A nouveau riche form of taking from the rich and giving to the poor. You know, like they did in 2000 right before the market dropped 85%. Caterpillar, Valero, Titanium Metals, Nucor, Manitowoc, Inco are all rising charts with higher highs and higher lows. These are companies that are printing cash on the China story, the peak oil theory, the global building boom. The charts of these stocks are monthly charts showing ten years of data. The horizontal bar charts on the right side of the price charts are monthly volume a the corresponding price. See a pattern? Indeed, a very disorderly rise. Massive gaps in volume. Those are danger signs. Irrational sentiment. "I can see it. 1.3 billion people in China and houses, roads, bridges, TVs and schools for all. I am going to be rich!" Stupid money or momentum money chasing stocks. Don't equate stupid with momentum. They can be mutually exclusive. Stupid is to hold when momentum fails. Riding momentum while it is strong is not stupid. That's called making money. If you believe in mean reversion after disorderly price increases, and you should because that is what happened to the Nasdaq post 2000, reversion happens around volume. Fibonacci retracements? Ah. Maybe some self fulfilling prophecy there. Retracement to areas of significant volume. Absolutely.
So, further down we've got a few additional charts of similar patterns which have progressed a little further into their cycle. Toll Brothers, Oracle and Intel. Toll Brothers is in the middle of a retracement. The Hovnanian CEO was recently on Bloomberg stating the downside risk to his company seemed minimal given it was trading at book value and used to trade at two times book value. Really? At two times book value, your stock was a bubble of the likes seldom seen. At book value, your stock is only overvalued by about 50% in my estimation. Remember, this is a CEO, along with all of the other homebuiding CEOs, who were on CNBC daily telling you how smart they were. To be fair, I'm sure they are quite capable at running their businesses but not at telling you when to buy or sell their stock. Oracle and Intel have had quite a few years to retrace. Isn't it odd that all charts started out looking the same way? Isn't it ironic that price and volume find a stasis over time? Finally, look at the daily chart of the Nasdaq 100 ETF, QQQQ. There isn't ten years of data behind it because it hasn't been available that long but looks like alot of virgin territory with respect to volume at higher prices doesn't it? If I printed monthly data there would also be gaps on this chart but I chose daily to give you a better view of where we are today with respect to the Nasdaq 100. Do you wonder why big money was dumping shares the first six months of this year?
So, I ask you again, is sentiment bullish or bearish? Has sentiment in these stocks been bullish or bearish? If sentiment surveys are bearish at a point where market leader charts look like this, do you want to be a contrarian? Is Wall Street about to leave main street holding the bag again? Being a contrarian isn't all it's cracked up to be. Being on the right side of the trade is.
This is a tool anyone can use. It's readily available via many investment services and many offer it free as part of their investment tools. Very few people know about it or know how to use it. That includes Wall Street professionals. It's very basic so it isn't because they aren't capable of using it. It's because they are too busy crawling through balance sheets trying to predict the future of corporate earnings with a Ouija board. Learn to use it and save yourself some money.
Click on the following charts for a larger view.


<< Home