


Oil
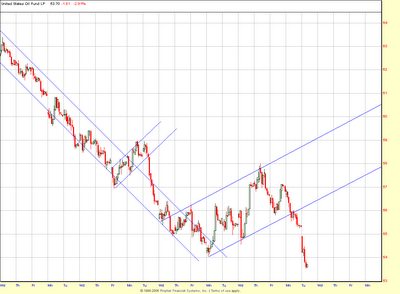
The USO Oil ETF has just completed a classic ABC pattern on the intraday charts after cratering recently. Isn't it timely that the introduction of this ETF coincided with a 25%ish percent correction in oil. Just in time for the peak oilers to buy the ETF and be left holding the bag. This ETF has quickly gained some significant liquidity and I would actually consider this a "tradeable" investment vehicle because of such. To me liquidity is extremely important. I don't want to be caught eating an order which is has a terrible fill.
So, if the oil bulls are going to start another short term march here, and it would be short term in my estimation because oil is clearly broken, the time might be now. I haven't done any type of analysis at all other than looking at this intraday chart pattern so this is not any kind of endorsement. Hey, what do you expect for free? I have no desire to be whipsawed by the increased volatility we are likely to see as oil likely carves out an intermediate or long term top. Just an interesting chart.
So, if the oil bulls are going to start another short term march here, and it would be short term in my estimation because oil is clearly broken, the time might be now. I haven't done any type of analysis at all other than looking at this intraday chart pattern so this is not any kind of endorsement. Hey, what do you expect for free? I have no desire to be whipsawed by the increased volatility we are likely to see as oil likely carves out an intermediate or long term top. Just an interesting chart.


<< Home