


Elliott Wave Confirmation That The Bull Market Is Over?

Charts courtesy of Prophet.net. You may increase the size of either chart by clicking on them
First off, even though today was a massive upside day, there were many things that happened today which are still extremely troubling. This market is a very risky market.
A little more on pattern recognition. Elliott Wave Theory is a source of analysis used by many professional traders to determine market direction. The Reader's Digest overview of the theory is that upward moving or bull markets are comprised of three major pulse waves separated by two corrective pulses. These movements are actually rooted in the behavioral responses shown time and again by individuals. And, since human behavior never changes, these patterns are repeatable or so the theory states.
EWT is the most loved or most hated tool out there. Some swear by it and some swear at it. While the theory has been around for the better part of a century, one man, Robert Prechter, made it famous in modern times. Prechter called the beginning of the great bull market starting in 1982 and lasting until 1999 or 2000 depending on your frame of reference. The problem was Prechter became bearish not long after his 1982 call and he missed the entire bull market.
EWT is not a trading tool in my opinion. What I mean is that this alone should not be used to commit money to any market. Many people use this as their only method to make trading decisions. Robert Prechter was obviously not a trader. He was a book writer and t-shirt salesman for his theories which are valid in many instances. But, my point is he was focused on making money off of his subscribers rather than using Elliott Wave as a trading tool. That is why his return was a compounded -18% when he missed the entire bull market in stocks.
Another point worth mentioning is that one needs to know when and how to apply EWT. Most people simply don't know how to determine where a pulse ends and a corrective phase begins. If you ask ten people to draw an Elliott Wave pattern on a chart, you might get ten different charts. I believe this misuse of EWT is part of what gives it a bad reputation with some people. That said, almost every serious trader in every market, be it commodities, bonds, forex or equities heeds its warnings and, at a minimum, uses it anecdotally. Some people have used doodads like Fourier transforms and fractal mumbo jumbo to make it appear their EWT work is more sophisticated to the mathematically challenged. ie, It sounds sophisticated to the average mutual fund manager or nonscience oriented investor. Frankly, I've had Fourier, LaPlace and Z transforms coming out of my ears from control system design work and I'm not impressed by using such big words with EWT. It's hocus pocus marketing. One final statement. I don't make my investment decisions surrounding EWT but it is one form of confirmation which may be beneficial.
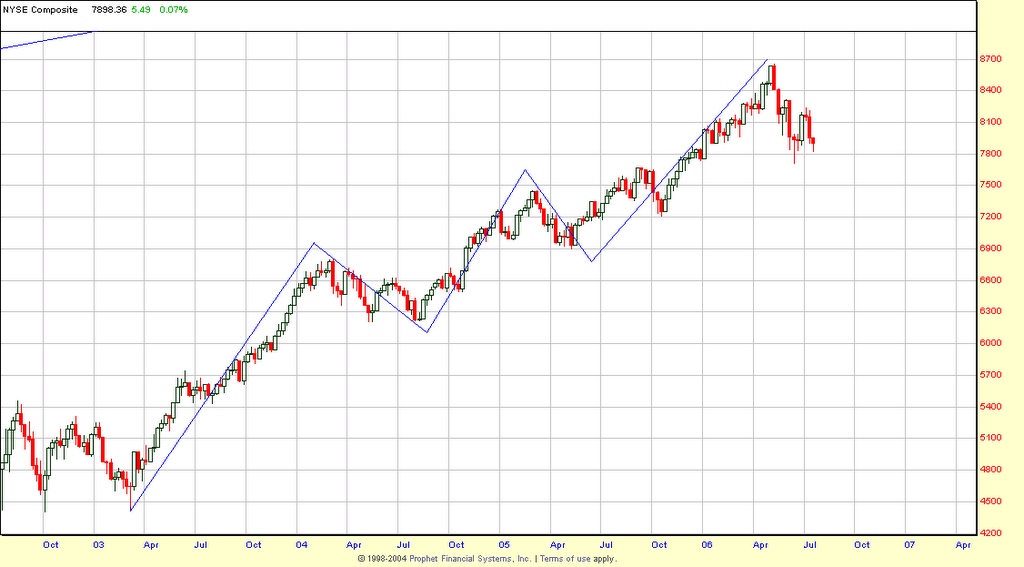
So, the charts above are based on some work I did in March and April of this year. They include Phelps Dodge, a commodities mining company and the New York Stock Exchange Index. I won't include the mathematical calculations surrounding the Fibonacci ratios in this work (another lengthy topic) because I don't want to type myself to death but you may draw your own conclusions from the visual representations. The Charts are weekly and are similar to patterns exhibited on the Broker/Dealers Index, the Transports and many other stocks. It might also be worth noting that Phelps Dodge, a very mature company in a very mature industry that has been around for half a century or more was trading 5-8 million shares a month pre year 2000. We ended up trading up to 150 million shares a month recently. That is a 30x increase! This isn't Microsoft or Cisco doubling revenues every year. It's an old fashioned commodity copper miner. This is surely a sign of euphoria and a confirmation of the Elliott Wave patterns in my opinion.

<< Home