Follow Up On The Oil Service Sector

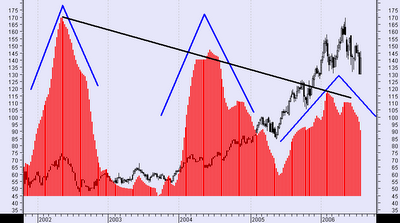
As I mentioned earlier in the week, I would post a chart of the oil services sector ETF, OIH, later this week which is significantly more telling. Looking at the first chart I posted, there is really nothing to be interpreted other than OIH is in an uptrend and the volume over the past few years has exploded. That is why volume is most telling data in evaluating equities. Above is the same chart of OIH. Overlaid on the chart are positive volume surges. Even though the first chart clearly showed volume has increase by ten fold over the last few years, the volume data on this chart shows a different story. In addition, the above volume data is normalized and takes into account seasonal patterns of higher and lower volume.
So, what does this chart tell me? I obviously see three significant pulses as the oil services sector exploded. The first and most powerful pulse happened in 2002 near the beginning of this bull market. This is the accumulation phase. This is when the sophisticated money and strategic thinkers were getting into oil. The people that knew oil was going to run before it became obvious: Goldman Sachs, Merrill Lynch, etc. Not their clients mind you but their proprietary trading desks which would be the leaders in driving oil higher. The second pulse was based on fundamentals. Earnings started coming in that were ahead of expectations. Upward revisions of fundamentals were becoming common. Here, the masses started accumulating oil stocks: money managers and smart individual traders. Finally, we have the last pulse. This is when the crowd started buying. Group think. Water cooler talk. Peak oil. Oil to $100 (which I noted earlier was a possibility). We are running out of oil. Mania. And, the bulls who were buying in 2001, 2002 and 2003 were buying $20 million condos in New York City because they were printing money.
Remember, in 2001 and 2002 an oil futures contract could be purchased for a few thousand in margin. 8,000 barrels in an oil futures contract. So, if oil goes up $50 a barrel and you roll that contract all the way through you are looking at $400,000 on an initial investment of a few thousand bucks. Now, let's say a big trader owned 10,000 contracts. Well, you can do the math. $400,000*10,000. Now you know why Goldman has been ringing the register with tens of billions in trading profits this cycle. They didn't go that buying Yahoo.
So, to summarize I sort of view this as the fundamentals behind the concept of Elliot Wave theory. The theory is based on repeatable human behavior which can manifest itself in patterns. Usually three upward waves. Notice, that even though the final wave on the first chart has significantly more volume behind it, on the volume chart, it has the weakest normalized volume. Is interest in oil fading? Does the smart money know something we don't?
So, in closing, could the oil service sector go to new highs? Sure it could. Will it stay there? Well, I could win the lottery. Could the enthusiasm return and drive positive volume through the roof again? Well, of course. But, there's one fly in the ointment. For enthusiasm to return to the oil service sector would require it do something that has never done in any business cycle this century. Remember, human behavior never changes.


<< Home