Irrational Exuberance

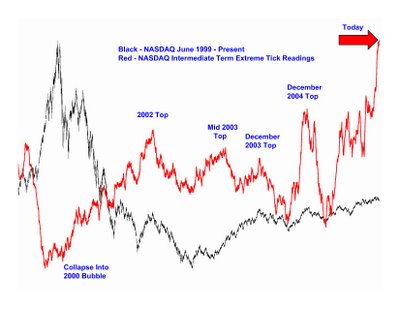
Here is a chart of market internal strength as measured by buying and selling pressure. Tick readings actually. What is a "tick"? A "tick" is the minimum upward or downward movement of a stock. Stocks closing on their up tick are usually under accumulation. Vice versa for a down tick. Extreme readings in either direction are good sentiment indicators of bearishness or bullishness. ie, The higher the red line, the more crazy people are acting in the stock market. That almost always foretells a very risky situation. It can yield additional insight into exuberance or lack thereof than simply looking at esoteric data. ie, Regardless of what the sentiment surveys are saying, there appears to be alot of optimistic people taking a tremendous amount of risk right now. More so than anytime this cycle. Frankly, more so than anytime in six years or more. That contrasts with 2003 when we had a subdued, more orderly flow of investment dollars pushing the market higher.
Now, I hate to say I told you so but I sent this chart to a few friends back on April 20th then updated again on May 5th. This is the chart updated from May 5th. On May 5th, the bulls were crowing about how great the economy was and how the stock markets around the globe were doing so well. Just a few days later we saw international stock markets tank by 20-35% and many of the market leaders in the US had similar crushing losses. So, is the fun over?


<< Home