


Tom Fool Trickery?
To harken back to my childhood days in the 14th century, the market action recently has had an air of Tom Foolery to it. What do Wal-mart, IBM, Oracle, Starbucks and Coach all have in common? Someone is driving very unusual action in all of the stocks. Each stock has gapped up pre-market 5-10% in a single day on massive volume. And, I do mean massive.
It isn't the average day trader making these moves. In the case of Wal-mart, a $200 billion market cap company, it rocket up over 5% in a single day on the highest volume in over twenty years. This was on a day it was announced their sales were poor and they were reducing the rate of growth. Wal-mart added $10 billion in market value at the tail end of the business cycle on a negative announcement. And this was after Wal-mart shot from a 52 week low to a 52 week high in a matter of weeks as happened with Target as I had outlined in a prior post. Just so happens to also be a day that it was announced Wal-mart short interest was at or near an all time high. To a lesser extent there are another twenty major companies with the same activity. In addition, the stocks have not really followed through to the upside in any of these moves telling me they may want to fill those gaps on the downside when temporary support dries up.
I am assuming the same players jamming the index futures higher in the morning over the past few months are responsible for the extremely odd action in these stocks. And, that if they are pushing the averages higher for a reason. I suspect that reason is ultimately distribution after their books close. There are many significant parallels to the March 2000 top and the May 2006 top and there are many parallels to what has happened since.
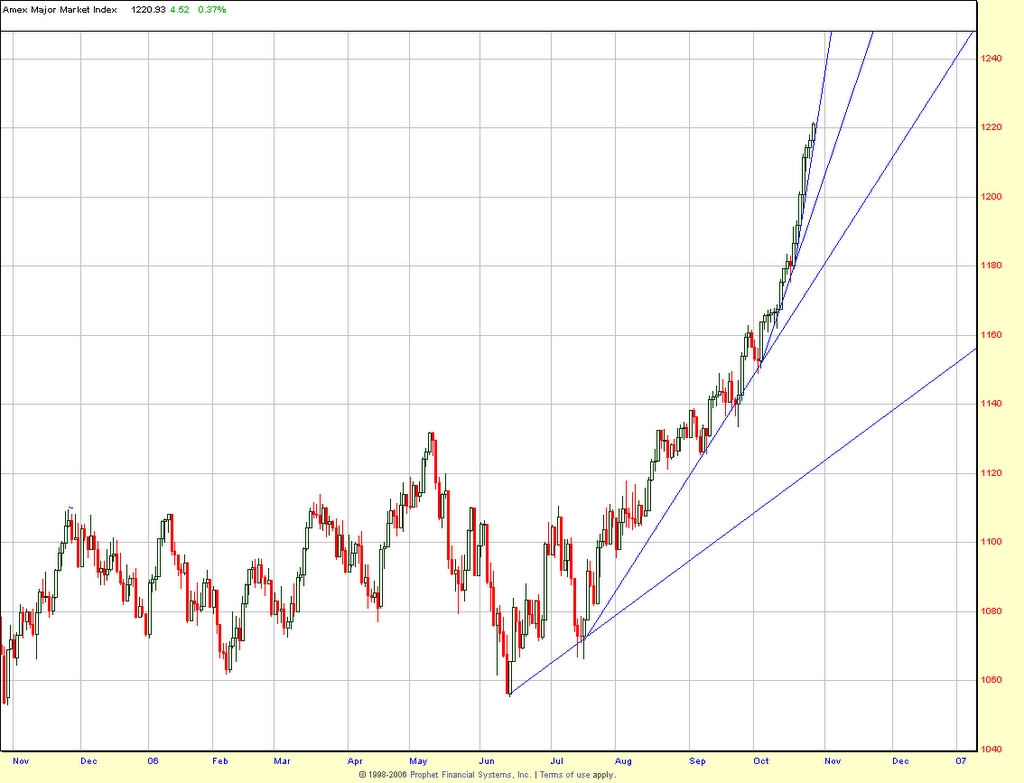
I have never, in my mundane act of looking at hundreds of thousands of charts, seen any index chart like the current Major Market Index posted below. Even in 2000 the Nasdaq chart didn't make such a parabolic rise. Usually indices develop a move upward and fall back some amount then move upward then fall back. That is healthy market action. Trend lines with rising and subsequently even more steep slopes which are almost parabolic are typically signaling future weakness. Why? It is usually a sign of mania. After the mania subsides we come to realize everyone is on the same side of the trade and there are no more buyers.
What is this blow upwards in mega-caps telling us? Whatever it is, I have a hard time believing it is good. If it was an orderly rise, I would be more inclined to say it could continue a while longer as large caps did in 1998 as small caps corrected. Instead, the wildly overvalued small caps are not correcting but, in fact, are showing a similar pattern of steeper trend lines. What is this telling us?
@Mania?
@A blow off bull market top?
@ Anticipation of rate cuts which not come?
@A realization rate cuts won't be coming thus pushing a drive to close out October with positive returns?
@A sign that inflationary monetary policy is about to enter a critical phase?
@A mad dash to mega-cap safety because the economy is in for a very hard landing?
@Fear that emerging markets are very exposed and a flight to safety?
Those are the only considerations I can logically come up with. In the end, while the market is irrational at times, logic always wins out. It's just that markets can remain irrational longer than you can remain solvent to loosely quote JMK. Anyone have any other reasonable explanations? Frankly, this move bothers me more than the housing data. Not because I'm afraid of new highs. But, because I've never seen anything like this type of Tom Foolery.

It isn't the average day trader making these moves. In the case of Wal-mart, a $200 billion market cap company, it rocket up over 5% in a single day on the highest volume in over twenty years. This was on a day it was announced their sales were poor and they were reducing the rate of growth. Wal-mart added $10 billion in market value at the tail end of the business cycle on a negative announcement. And this was after Wal-mart shot from a 52 week low to a 52 week high in a matter of weeks as happened with Target as I had outlined in a prior post. Just so happens to also be a day that it was announced Wal-mart short interest was at or near an all time high. To a lesser extent there are another twenty major companies with the same activity. In addition, the stocks have not really followed through to the upside in any of these moves telling me they may want to fill those gaps on the downside when temporary support dries up.
I am assuming the same players jamming the index futures higher in the morning over the past few months are responsible for the extremely odd action in these stocks. And, that if they are pushing the averages higher for a reason. I suspect that reason is ultimately distribution after their books close. There are many significant parallels to the March 2000 top and the May 2006 top and there are many parallels to what has happened since.
I have never, in my mundane act of looking at hundreds of thousands of charts, seen any index chart like the current Major Market Index posted below. Even in 2000 the Nasdaq chart didn't make such a parabolic rise. Usually indices develop a move upward and fall back some amount then move upward then fall back. That is healthy market action. Trend lines with rising and subsequently even more steep slopes which are almost parabolic are typically signaling future weakness. Why? It is usually a sign of mania. After the mania subsides we come to realize everyone is on the same side of the trade and there are no more buyers.
What is this blow upwards in mega-caps telling us? Whatever it is, I have a hard time believing it is good. If it was an orderly rise, I would be more inclined to say it could continue a while longer as large caps did in 1998 as small caps corrected. Instead, the wildly overvalued small caps are not correcting but, in fact, are showing a similar pattern of steeper trend lines. What is this telling us?
@Mania?
@A blow off bull market top?
@ Anticipation of rate cuts which not come?
@A realization rate cuts won't be coming thus pushing a drive to close out October with positive returns?
@A sign that inflationary monetary policy is about to enter a critical phase?
@A mad dash to mega-cap safety because the economy is in for a very hard landing?
@Fear that emerging markets are very exposed and a flight to safety?
Those are the only considerations I can logically come up with. In the end, while the market is irrational at times, logic always wins out. It's just that markets can remain irrational longer than you can remain solvent to loosely quote JMK. Anyone have any other reasonable explanations? Frankly, this move bothers me more than the housing data. Not because I'm afraid of new highs. But, because I've never seen anything like this type of Tom Foolery.

<< Home