


Volume At Price Part II
A few months ago I posted similar volume at price charts to the Apple and Google charts below. I received some feedback asking for clarification of how to interpret the charts, so I figured now would be an opportune time to do so since there is a fair amount of evidence both are are carving out tops.
Volume at price charts and their meaning are very simple so my first comment is not to read too much into them. The data provided is a distribution of volume at specific prices over a period of time. The time frame used is arbitrary. Day traders may use the price at volume charts to look for support or resistance of the prior day's action. Support and resistance ranges are typically found where 70% volume distribution is found on the prior day's chart. Obviously, support if the price closes above yesterday's concentrated volume distribution and resistance if it closes below yesterday's volume distribution.
Let's look at an example to clarify the concept. Yesterday, prices in the crude futures market started at $10. By noon, prices had risen to $11. By 4pm prices had fallen to $10.25. While looking at the price at volume charts for crude intraday, we find that 70% of the volume was distributed at $10.75 to $11. A plausible interpretation might be that sellers were in control and were distributing shares as prices rose to $11. So, although the price of crude went up, were the buyers actually in control? The next day, traders would consider this information to determine their trading strategy whatever that might be. Obviously an extremely simple example which I am limiting to keep my typing to a minimum.
For more explanation including breakouts, breakdowns and other interpretations, I'd recommend reading more about the Market Profile, which I loosely consider analogous to volume at price charts. The market profile does more of the work for you but the concept is similar. To read more of Market Profile tactics and how to interpret Market Profile data, please visit the Chicago Board of Trade site here. There are links for studies, books and educational material from the Market Profile home page.
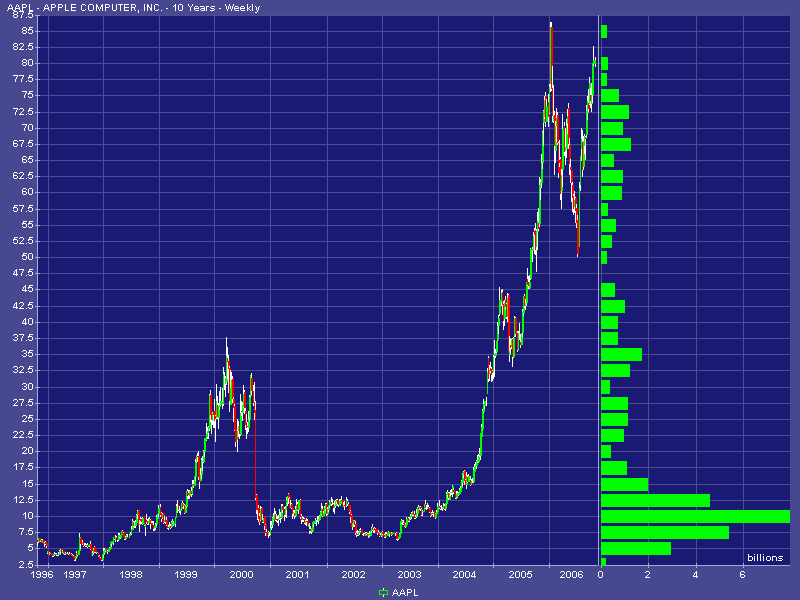
Let's look at how this data might be used on a longer term basis looking at the Apple and Google charts. Long term volume at price charts can give clues to areas of support and resistance. Again, as I said before, resistance above and support below the current price. There is no magic in determining the time frame. You may choose to use since the start of this bull cycle to help determine where a buy point may be on a normal pull back. You may choose the last ten years as I have. Let me tell you why I am using ten years of data. It is strictly based on fundamentals. For reasons I have outlined on this blog as well as other work I have done, I believe we are in a negative cycle and that stocks have not finished their correction post 2000. Especially consumer stocks. So, I want to see pockets of large volume at specific prices to anticipate where support might be in the event of a correction. ie, Those are points where buyers likely stepped in and initiated heavy support just as I discussed on the intraday strategy above. I'll marry that data with support & resistance, trend line and some proprietary fundamental and quantitative analysis to determine a resultant guesstimate. Now, with the stocks going up, I'm making a pretty bold statement by posting this. Maybe I'll get my head handed to me. But, unless something changes, my work is telling me these stocks are weaker than their prices reflect.
The odds are not with Apple or Google that they will continue higher forever. The market always reprices risk. There is so much excess and one way thinking priced into these stocks that it wouldn't take that much to see a change in sentiment for either company. Remember, both of these may be great companies but it was just a handful of years ago Apple was a retread. Now, because of one limited-life product the company has somehow achieved enlightenment within the investment community. All I will say is Apple has been this overpriced only a handful of times in the last twenty five years. Each of those times it was considered on the path to nirvana. Following said thinking the stock proceeded to decline between 50% and 80%. So, I'm quite confident those who believe Apple's future is without risk do not have the odds in their favor. I don't think I need to say alot about Google as I just recently posted about Google. Even if the long term fundamentals remain positive, the odds are the market will reprice risk at some point. Again, you are being paid nothing in the form of a dividend to own these stocks. Therefore, investors are betting. Neither Ben Graham nor Warren Buffett, the two most successful investors ever to grace our presence, would buy either of these stocks today unless they changed their longstanding discipline.
So, looking at price at volume and nothing else, where might we find support for these two stocks?


Again, the information on this site is provided for discussion purposes only and are not investing recommendations. Under no circumstances does this information represent a recommendation to buy or sell securities.
Volume at price charts and their meaning are very simple so my first comment is not to read too much into them. The data provided is a distribution of volume at specific prices over a period of time. The time frame used is arbitrary. Day traders may use the price at volume charts to look for support or resistance of the prior day's action. Support and resistance ranges are typically found where 70% volume distribution is found on the prior day's chart. Obviously, support if the price closes above yesterday's concentrated volume distribution and resistance if it closes below yesterday's volume distribution.
Let's look at an example to clarify the concept. Yesterday, prices in the crude futures market started at $10. By noon, prices had risen to $11. By 4pm prices had fallen to $10.25. While looking at the price at volume charts for crude intraday, we find that 70% of the volume was distributed at $10.75 to $11. A plausible interpretation might be that sellers were in control and were distributing shares as prices rose to $11. So, although the price of crude went up, were the buyers actually in control? The next day, traders would consider this information to determine their trading strategy whatever that might be. Obviously an extremely simple example which I am limiting to keep my typing to a minimum.
For more explanation including breakouts, breakdowns and other interpretations, I'd recommend reading more about the Market Profile, which I loosely consider analogous to volume at price charts. The market profile does more of the work for you but the concept is similar. To read more of Market Profile tactics and how to interpret Market Profile data, please visit the Chicago Board of Trade site here. There are links for studies, books and educational material from the Market Profile home page.
Let's look at how this data might be used on a longer term basis looking at the Apple and Google charts. Long term volume at price charts can give clues to areas of support and resistance. Again, as I said before, resistance above and support below the current price. There is no magic in determining the time frame. You may choose to use since the start of this bull cycle to help determine where a buy point may be on a normal pull back. You may choose the last ten years as I have. Let me tell you why I am using ten years of data. It is strictly based on fundamentals. For reasons I have outlined on this blog as well as other work I have done, I believe we are in a negative cycle and that stocks have not finished their correction post 2000. Especially consumer stocks. So, I want to see pockets of large volume at specific prices to anticipate where support might be in the event of a correction. ie, Those are points where buyers likely stepped in and initiated heavy support just as I discussed on the intraday strategy above. I'll marry that data with support & resistance, trend line and some proprietary fundamental and quantitative analysis to determine a resultant guesstimate. Now, with the stocks going up, I'm making a pretty bold statement by posting this. Maybe I'll get my head handed to me. But, unless something changes, my work is telling me these stocks are weaker than their prices reflect.
The odds are not with Apple or Google that they will continue higher forever. The market always reprices risk. There is so much excess and one way thinking priced into these stocks that it wouldn't take that much to see a change in sentiment for either company. Remember, both of these may be great companies but it was just a handful of years ago Apple was a retread. Now, because of one limited-life product the company has somehow achieved enlightenment within the investment community. All I will say is Apple has been this overpriced only a handful of times in the last twenty five years. Each of those times it was considered on the path to nirvana. Following said thinking the stock proceeded to decline between 50% and 80%. So, I'm quite confident those who believe Apple's future is without risk do not have the odds in their favor. I don't think I need to say alot about Google as I just recently posted about Google. Even if the long term fundamentals remain positive, the odds are the market will reprice risk at some point. Again, you are being paid nothing in the form of a dividend to own these stocks. Therefore, investors are betting. Neither Ben Graham nor Warren Buffett, the two most successful investors ever to grace our presence, would buy either of these stocks today unless they changed their longstanding discipline.
So, looking at price at volume and nothing else, where might we find support for these two stocks?

Again, the information on this site is provided for discussion purposes only and are not investing recommendations. Under no circumstances does this information represent a recommendation to buy or sell securities.

<< Home