


Market Sentiment And Why A Trusted Indicator Will Likely Fail
There are a tremendous amount of Wall Street professionals calling for a stock market rally right here. Some for a rally as long as four to six weeks. Many, frankly, are bullish that growth will continue unabated and we are setting the ground work for a protracted bull market. They may be right. Then again, they may not be. Bullish investors have used one indicator as a form of bottom picking for the last two decades. The question is if it will continue to perform as it has without flaw if a new bear market develops.
That indicator is the survey results indicating the percentage of bulls and bears. There are quite a few of these surveys monitoring the sentiment of different groups of people. It could be amongst individual investors, professional money managers, etc. They worked quite effectively in the 1990s up through today. I would argue they worked through the 2000-2003 slaughter because people had never seen anything like an 80% drop in a stock market index like we saw in the Nasdaq. So, you had a generational bullishness that was not going to be broken by a correction after nearly twenty years of unabated rising stock prices. They were conditioned to use sell offs as a buying opportunity. So, you had alot of individual investors and very optimistic professional money managers holding through declines and actually adding to their positions. SAs stocks declined, greed instinctively took over and a tremendous amount of money bought stocks that were cratering on the anticipation they would rebound. It was a goldilocks economy or so we were told. Hence, the opninon stocks would surely come back up. That is likely why the chart I posted under Irrational Exuberance shows rising tick data in a collapsing marketing post 2000. ie, "Dip" buyers. Not to be confused with "Dipsh*t" buyers who they actually turned out to be.
http://tinyurl.com/po7z7
This also explains why sentiment readings worked so well in this period. Professional money managers and individual investors had never seen anything other than the late 1980s and 1990s and were conditioned just like Pavlov's dog, to buy the dips. For those who aren't familiar with Pavolv, he was a Russian scientist who proved dogs and even humans can be trained to respond in a certain way to a particular stimulus. Hence investors were trained to buy the dips and were rewarded just like Pavlov's dog was rewarded. Trained to respond to negative sentiment readings as a buying opportunity.
Today, that same scenario exists. The Wall Street traders and professionals are drooling, just as Pavlov's dog did, at the "great" buying opportunity presented here because the market dropped 5-10% and sentiment is very negative. Will they we rewarded with a bone? They might. I still have no positive clarity yet with my work.
Back to the sentiment indicator. The question is, why do I think they have a good chance this trusted indicator will likely fail at some point? (I cannot predict when it will happen just a rational historical perspective on why it likely will.) Well, one obvious answer is that it failed near the very top of the Nasdaq bubble in 2000. Sentiment was very negative at the end of 2000. Yet, we had really not even started any type of serious correction yet. Thus, at market tops and end of bull markets it appears very unreliable. And, I will argue in a post I will get up on Monday that we are not just at a top, we are at another bubble top. But, here's the main reason why from a historical perspective.
This market is very similar to 1973. Prior to 1973 we had a blow off stock bubble similar to the 1990s. It culminated with the most overvalued stock market since the stock market crash of 1929. The broad market declined from 1968-1970 about the same amount as we saw in 2000-2003 then the market started a rally in 1970 that correlates quite nicely to 2003. That rally and business cycle was very similar to today. A few highlights were:
@Profits were fueled by global growth
@High commodity prices and high oil prices
@Low interest rates
@A housing boom
@A weak dollar
@General malaise and fears of Japan taking over our economic mantle
@The S&P 500 PE was almost the same as today
@Very cyclical earnings similar to today where earnings are the most cyclical in 50 years.
That market eventually saw the S&P 500 fall another 50% in 1974. I expect mid 2006 to 2007 as the correlation to 1974. Picking exact tops is very difficult but my work showed we were likely topping in April or May of this year. Will that ultimately prove correct? We'll just have to wait and see because predicting exact data points is difficult. It is akin to palm reading. But, the bigger picture is less difficult to foretell and that is a very dangerous next twelve to eighteen months in my estimation.
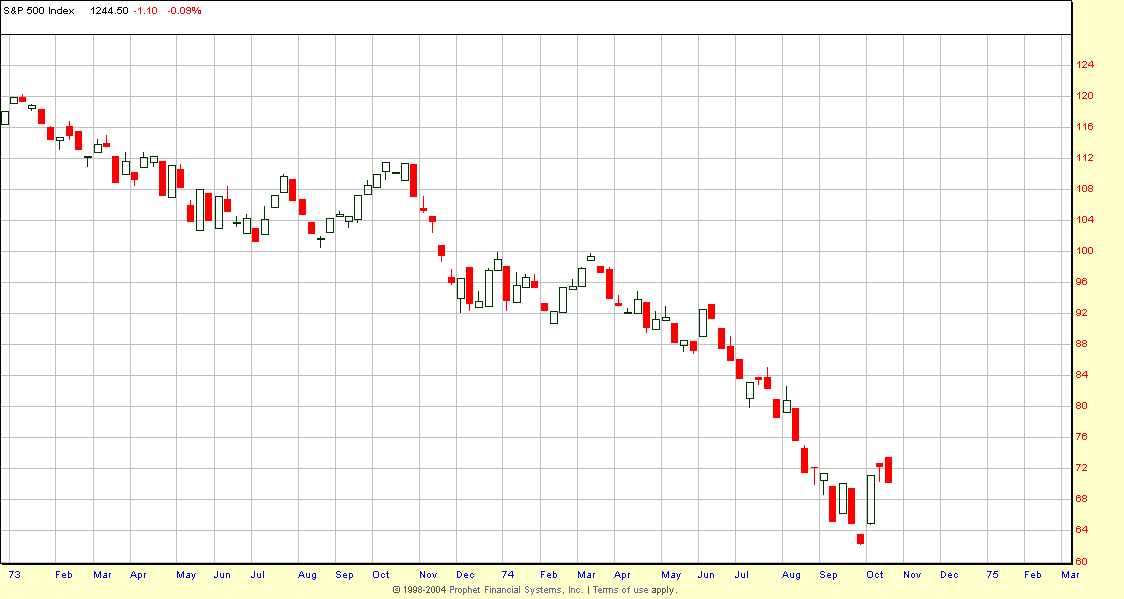
So, given we are in the exact same phase in the business cycle and the stock market cycle, emotions would likely be very similar to 1973-74. Sentiment surveys, if available, would likely be very similar to today. A very skittish investor who had just experienced the stock market being slaughtered three years prior. When the market started to drop into 1973, did likely lousy sentiment fuel rallies? Did oversold conditions cause great bounces lasting months? Not really. So, will the fact that we have more "traders" today make sustained rallies more of a possibility or will the sentiment indicators that served bulls so well in the 1990s and the transition to a bear market in 2000 still work? Only time will tell but I would be very cautious if we have entered a new bearish market environment. My point is sentiment became very bullish for years on end in the 1990s. There is no reason the opposite could not happen for a period of a year or two if we start to see the market drop today. Below is a chart of the S&P 500 in the selloff of 1973-74. 18 months of selling and very sour sentiment didn't save the market then.
Again, chart courtesy of the brilliant team at Prophet.net

That indicator is the survey results indicating the percentage of bulls and bears. There are quite a few of these surveys monitoring the sentiment of different groups of people. It could be amongst individual investors, professional money managers, etc. They worked quite effectively in the 1990s up through today. I would argue they worked through the 2000-2003 slaughter because people had never seen anything like an 80% drop in a stock market index like we saw in the Nasdaq. So, you had a generational bullishness that was not going to be broken by a correction after nearly twenty years of unabated rising stock prices. They were conditioned to use sell offs as a buying opportunity. So, you had alot of individual investors and very optimistic professional money managers holding through declines and actually adding to their positions. SAs stocks declined, greed instinctively took over and a tremendous amount of money bought stocks that were cratering on the anticipation they would rebound. It was a goldilocks economy or so we were told. Hence, the opninon stocks would surely come back up. That is likely why the chart I posted under Irrational Exuberance shows rising tick data in a collapsing marketing post 2000. ie, "Dip" buyers. Not to be confused with "Dipsh*t" buyers who they actually turned out to be.
http://tinyurl.com/po7z7
This also explains why sentiment readings worked so well in this period. Professional money managers and individual investors had never seen anything other than the late 1980s and 1990s and were conditioned just like Pavlov's dog, to buy the dips. For those who aren't familiar with Pavolv, he was a Russian scientist who proved dogs and even humans can be trained to respond in a certain way to a particular stimulus. Hence investors were trained to buy the dips and were rewarded just like Pavlov's dog was rewarded. Trained to respond to negative sentiment readings as a buying opportunity.
Today, that same scenario exists. The Wall Street traders and professionals are drooling, just as Pavlov's dog did, at the "great" buying opportunity presented here because the market dropped 5-10% and sentiment is very negative. Will they we rewarded with a bone? They might. I still have no positive clarity yet with my work.
Back to the sentiment indicator. The question is, why do I think they have a good chance this trusted indicator will likely fail at some point? (I cannot predict when it will happen just a rational historical perspective on why it likely will.) Well, one obvious answer is that it failed near the very top of the Nasdaq bubble in 2000. Sentiment was very negative at the end of 2000. Yet, we had really not even started any type of serious correction yet. Thus, at market tops and end of bull markets it appears very unreliable. And, I will argue in a post I will get up on Monday that we are not just at a top, we are at another bubble top. But, here's the main reason why from a historical perspective.
This market is very similar to 1973. Prior to 1973 we had a blow off stock bubble similar to the 1990s. It culminated with the most overvalued stock market since the stock market crash of 1929. The broad market declined from 1968-1970 about the same amount as we saw in 2000-2003 then the market started a rally in 1970 that correlates quite nicely to 2003. That rally and business cycle was very similar to today. A few highlights were:
@Profits were fueled by global growth
@High commodity prices and high oil prices
@Low interest rates
@A housing boom
@A weak dollar
@General malaise and fears of Japan taking over our economic mantle
@The S&P 500 PE was almost the same as today
@Very cyclical earnings similar to today where earnings are the most cyclical in 50 years.
That market eventually saw the S&P 500 fall another 50% in 1974. I expect mid 2006 to 2007 as the correlation to 1974. Picking exact tops is very difficult but my work showed we were likely topping in April or May of this year. Will that ultimately prove correct? We'll just have to wait and see because predicting exact data points is difficult. It is akin to palm reading. But, the bigger picture is less difficult to foretell and that is a very dangerous next twelve to eighteen months in my estimation.
So, given we are in the exact same phase in the business cycle and the stock market cycle, emotions would likely be very similar to 1973-74. Sentiment surveys, if available, would likely be very similar to today. A very skittish investor who had just experienced the stock market being slaughtered three years prior. When the market started to drop into 1973, did likely lousy sentiment fuel rallies? Did oversold conditions cause great bounces lasting months? Not really. So, will the fact that we have more "traders" today make sustained rallies more of a possibility or will the sentiment indicators that served bulls so well in the 1990s and the transition to a bear market in 2000 still work? Only time will tell but I would be very cautious if we have entered a new bearish market environment. My point is sentiment became very bullish for years on end in the 1990s. There is no reason the opposite could not happen for a period of a year or two if we start to see the market drop today. Below is a chart of the S&P 500 in the selloff of 1973-74. 18 months of selling and very sour sentiment didn't save the market then.
Again, chart courtesy of the brilliant team at Prophet.net

<< Home