


Conspiracy Theories And The Drop In Oil
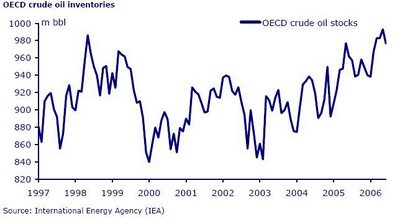
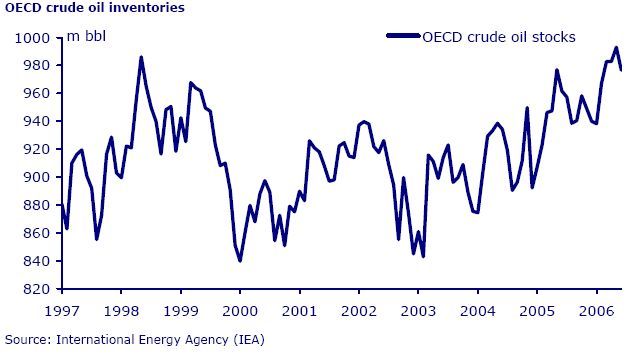
It seems rather vogue in the blogosphere to be blaming the drop in oil on Goldman's re weighting of a commodity index and an attempt to manipulate the outcome of the U.S. elections. While there is no definitive answer on why oil dropped, I could give a dozen facts rather than conspiracy theories. Fact: Fundamentally we have oil coming out of our ears. Fact: There is more excess oil in the system than when oil was less than $20 a barrel. (Forget about the stories of peak oil. It's not real. At least at this point it isn't.) Fact: The global economy's growth rate has dropped and smart money knew it would months ago. That is bad for oil. Fact: Oil executives were selling more shares of oil than at any time in history as I outlined on here months ago. Or, in Valero's case, as I recall the extremely savvy Bill Greehy sold more shares than he had over his entire cumulative career. Fact: Speculators were driving an enormous and unsustainable premium in oil. Below is an inventory chart of the OECD that I found somewhere on the net a few months ago. From where I can't recall but thanks to the IEA.
Now, I've been stating for some time that oil was due a correction and maybe more and we've backed it up with facts and quantitative analysis. Many oil stocks including one of my favorites, Valero, are up nearly 1,000% this cycle. I started talking about Valero as a weakening stock about six months ago. So, let's look at buying pressure on a daily Valero chart. My definition of buying pressure is not a price oscillator. In fact, it's not an oscillator. And, it's based on volume because I want to know what smart money is doing not what conspirators are saying. So, Valero peaks then attempts another rally with a lower peak and much lower buying pressure then it dumps. That pattern was in process months before Goldman re weighted its index. The same weakened buying pressure with an attempt at higher highs is on the crude futures chart and just about every other oil related chart as well.

And what about coal or natural gas? Isn't the strength in coal stocks tied to the same fundamentals as oil? Well, then how do we explain the 50-60% drop in coal stocks? Is that tied to some re weighted index as well? Below is Fording Coal which has been decimated since a peak in April. Or, what about natural gas which cratered and caused the Amaranth hedge fund to lose $6 billion in a month? Is that tied to some conspiracy as well? Do you realize what scale of conspiracy all of these events would take to happen simultaneously? It would truly mean we are living in an Orwellian society and everything you thought to be true was a total lie.

So, is it seemingly odd that elections coincided with the the drops across the entire energy complex? Sure it is. But, what about fundamentals don't you understand? Awash in oil in 2006 with a weakening economy and a speculative fervor which was climaxing? Since oil demand is tied to economic vibrancy, do we ultimately blame the Democrats for weakening the economy before the election so that they could take control of the Congress?
Conspiracy theories are generally perpetrated by those who don't have a firm grasp on facts and therefore cannot explain phenomenon with solid argument. So, what more realistic conclusion might you draw from the above data points? Global demand for energy is going to drop? The fundamentals are weakening? Speculators have driven energy to excesses not sustainable? More likely the reason for the drops across all energy stocks are for a reason with a perfectly valid set of facts.

<< Home