Tuesday, October 31, 2006

Volume At Price Part II

A few months ago I posted similar volume at price charts to the Apple and Google charts below. I received some feedback asking for clarification of how to interpret the charts, so I figured now would be an opportune time to do so since there is a fair amount of evidence both are are carving out tops.

The charts and their meaning are very simple so don't read too much into them. The data provided is a distribution of volume at specific prices over a period of time. The time frame used is arbitrary. Day traders may use the price at volume charts to look for support of the prior day's action. Support and resistance ranges are typically found where the 70% volume distribution is found on the prior day's chart. Support if the price closes above yesterday's concentrated volume distribution and resistance if it closes below yesterday's volume distribution. Let's look at an example. Yesterday, prices in the crude futures market started at $10. By noon, prices had risen to $11. By 4pm prices had fallen to $10.25. While looking at the price at volume charts for crude intraday, we find that 70% of the volume was distributed at $10.75 to $11. A plausible interpretation might be that sellers were in control and were distributing shares as prices rose to $11. So, although the price of crude went up, were the buyers actually in control? The next day, traders would consider this information to determine their trading strategy whatever that might be. Obviously an extremely simple example which I am limiting to keep my typing to a minimum.

For more explanation, I'd recommend reading more about the Market Profile, which I loosely consider volume at price charts analogous to. To read more of Market Profile tactics and how to interpret Market Profile data, please visit the Chicago Board of Trade site here. There are links for studies, books and educational material from the Market Profile home page.

Let's look at how this data can be used on a longer term basis looking at the Apple and Google charts. Long term volume at price charts can give clues to areas of support and resistance. Again, there is no miracle in determining the time frame. You may choose to use since the start of this bull cycle. You may choose the last ten years as I have. Let me tell you why I am using ten years of data. It is strictly for fundamental reasons. I believe we are in a negative cycle and that stocks have not finished their correction post 2000. So, I want to see pockets of large volume at specific prices to anticipate where support might be in the event of a correction. ie, Those are where buyers likely stepped in and initiated heavy buying just as I discussed on the intraday strategy above. I'll marry that data with support & resistance, trend line and some proprietary fundamental and quantitative analysis to determine a resultant guesstimate.

I can assure you the odds are not with Apple or Google that they will continue higher for much longer. The market always reprices risk. Both of these may be great companies but it was just a handful of years ago Apple was a retread. Now, because of a crude product everyone is enamored with today, it has achieved enlightenment. All I can say is Apple has been this overpriced two times in the last twenty five years. Once it declined over 50% and the other time it declined over 80%. So, I'm quite confident those who believe Apple's future is without alot of risk do not have the odds in their favor. I don't think I need to say alot about Google as I just recently posted about Google.

So, just looking at nothing other than these charts, where might we find support for these two stocks.

We are looking for large distributions of volume. These areas of price will act as support if below and resistance if above current pricing action.
posted by TimingLogic at 9:14 PM

76 Days And Counting: Tin Foil Hat Update, Mark

A few moments to spare so I thought I'd make a quick post on something I have mentioned a few times. We are on a very long streak without a 1% daily correction in the S&P 500 and the last two times led to significant sell offs. We officially passed the prior record this cycle a few weeks ago and are on the 76th day. It is also interesting to note we are currently on the longest march since 1990 (The last date I checked) without a single day 2% correction in the S&P 500. Talk about volatility drying up.

With economic data coming in below trend, I'm not sure the probabilities exist that this will continue.
+++++++++++++++++++++++++++++++++++++++++++++++++++++++++++++++++++
Update. JKW comments on this interesting or some may think ominous statistic I am moving to the front page of this post:

This is the longest without a 2% correction in SPX since at least 1950 (using closing prices from yahoo). The second longest was 806 days ending Oct 30, 1978. There are a total of 8 times (including this one) where it has been over 400 days. The long trend final days are:
now
Oct 30, 1978
Jan 7, 1986
May 11, 1973
Aug 25, 1966
Jul 25, 1969
Mar 7, 1996
Aug 7, 1959

Some of these were good times to buy, some of them were bad times to buy. It looks like 3 of them are near peaks, 2 are near troughs, 2 are on the way up, and this one can't be determined yet. Only 2 of them look like they were actually a bad time to buy. Looking at the statistics on DJI, it looks like a 2% correction after a long period without one signifies a change from one of up, down, trendless to another, but does not provide by itself any clear indication of which one it will change to. The exception seems to be that you can get a 2% correction in the middle of a long uptrend.
+++++++++++++++++++++++++++++++++++++++++++++++++++++++++++++++++++

Anyone else see anything spooky here? Let's look at JKW's stats from a cyclical bull or bear perspective. That rules out all but 1978 and 1973 for comparative purposes. Then let's look at the macro environment. Transitioning from a secular bullish bond environment in 1973. That rules out 1978 as today we are transitioning from a secular bullish bond environment to ..... TBD. May 11th, 1973 is our magic date.

So, when did the global markets start selling off this year? That's right. May 11th, 2006. What was the significance of that rally without a normal correction in 1973? Well, folks, it was the end of a failed upside rally after the market had peaked in January of that year. And, when did the NDX peak this year? That's right. January of 2006. I actually had a prior post dated October 3rd and titled "The Q's" where I circled that peak and said it was a primer. The exact quote from that post was "That move was used to prime the average investor into chasing everything from penny stocks to pink sheet stocks to blow offs in oils, metals, transports, brokers, emerging markets, etc. Likely the wave 5 of this bull market's leaders. During that rally into May, the big money was dumping ALOT of shares. I gave a few hints of this in some posts I made on other blogs as it was happening. The last time that happened? The outcome was very ugly. "

From a cycles perspective, that bull market cycle in 1973 was the first bull cycle in a secular bear market. Equities has sold off in 1969-1970 after reaching the highest valuation since the Great Depression. And, what of 2000? The highest valuation ever. And this cycle? First cycle in a secular bear market. So, same cycle as 1973 from that perspective.

If memory serves me well, 1969 was when a young buy & hold (hardee har har. Or if you prefer, Hardy Har Har.) Warren Buffett urged his clients to sell stocks because of overvaluation. One of the infamous Wile E. Coyote's timed investment decisions. Did you know he bought a massive amount of silver pre-2000 and sold it at the silver peak in May of 2006 as I recall. Don't believe his buy & hold mumbo jumbo. Buffett is not a country bumpkin. He is a brilliant market sage and a market timer whether it be buying stocks, bonds, companies, commodities or currencies.

And, what happened post May 11th, 1974? Das ist NOT goot. They cratered. When? Starting in NOVEMBER. And, what was the S&P PE in 1973? 18ish just like today. The perma-bulls now tell us how cheeeeaaaaappppp the market is. When did markets bottom in that cycle? October of the following year? When have I repeatedly said we would see an equity market bottom? October of the following year. ie, 2008.

When did Warren Buffett say he felt like a kid in a candy store when he was buying stocks on the cheap? (Not his direct quote.) October of 1974. That is when Buffett set his life in motion to make him the richest investor ever. Now that is one hell of a spooky Halloween treat. What would really be spooky is if it came to pass.
posted by TimingLogic at 11:17 AM

Chicago PMI Drops More Than Expected

A proxy for automakers is the Chicago Purchasing Manager's Index. The following data was released this morning:

@The Chicago PMI fell to 54.1% from 62.1% in September. Economists were expecting the index to fall to 58.7%.
@The employment index rose to 57% from 50.8%.
@The prices paid index fell to 62.5% from 69.8%.
@The new orders index fell to 54.1% from 67.3%.

Readings over 50% indicate growth in the region. With Ford recently announcing significant production cuts well into 2007 and all three American auto makers cutting production because of high inventories, it should be expected the Chicago PMI will continue to erode over coming months.
posted by TimingLogic at 10:07 AM

Monday, October 30, 2006

Tom Fool Trickery?

To harken back to my childhood days in the 14th century, the market action recently has had an air of Tom Foolery to it. What do Wal-mart, IBM, Oracle, Starbucks and Coach all have in common? Someone is driving very unusual action in all of the stocks. Each stock has gapped up pre-market 5-10% in a single day on massive volume. And, I do mean massive.

It isn't the average day trader making these moves. In the case of Wal-mart, a $200 billion market cap company, it rocket up over 5% in a single day on the highest volume in over twenty years. This was on a day it was announced their sales were poor and they were reducing the rate of growth. Wal-mart added $10 billion in market value at the tail end of the business cycle on a negative announcement. And this was after Wal-mart shot from a 52 week low to a 52 week high in a matter of weeks as happened with Target as I had outlined in a prior post. Just so happens to also be a day that it was announced Wal-mart short interest was at or near an all time high. To a lesser extent there are another twenty major companies with the same activity. In addition, the stocks have not really followed through to the upside in any of these moves telling me they may want to fill those gaps on the downside when temporary support dries up.

I am assuming the same players jamming the index futures higher in the morning over the past few months are responsible for the extremely odd action in these stocks. And, that if they are pushing the averages higher for a reason. I suspect that reason is ultimately distribution after their books close. There are many significant parallels to the March 2000 top and the May 2006 top and there are many parallels to what has happened since.

I have never, in my mundane act of looking at hundreds of thousands of charts, seen any index chart like the current Major Market Index posted below. Even in 2000 the Nasdaq chart didn't make such a parabolic rise. Usually indices develop a move upward and fall back some amount then move upward then fall back. That is healthy market action. Trend lines with rising and subsequently even more steep slopes which are almost parabolic are typically signaling future weakness. Why? It is usually a sign of mania. After the mania subsides we come to realize everyone is on the same side of the trade and there are no more buyers.

What is this blow upwards in mega-caps telling us? Whatever it is, I have a hard time believing it is good. If it was an orderly rise, I would be more inclined to say it could continue a while longer as large caps did in 1998 as small caps corrected. Instead, the wildly overvalued small caps are not correcting but, in fact, are showing a similar pattern of steeper trend lines. What is this telling us?

@Mania?
@A blow off bull market top?
@ Anticipation of rate cuts which not come?
@A realization rate cuts won't be coming thus pushing a drive to close out October with positive returns?
@A sign that inflationary monetary policy is about to enter a critical phase?
@A mad dash to mega-cap safety because the economy is in for a very hard landing?
@Fear that emerging markets are very exposed and a flight to safety?

Those are the only considerations I can logically come up with. In the end, while the market is irrational at times, logic always wins out. It's just that markets can remain irrational longer than you can remain solvent to loosely quote JMK. Anyone have any other reasonable explanations? Frankly, this move bothers me more than the housing data. Not because I'm afraid of new highs. But, because I've never seen anything like this type of Tom Foolery.

posted by TimingLogic at 6:19 PM

Sunday, October 29, 2006

Update On Pairs Trade Post With Phelps Dodge And Newmont Mining

We are seeing the largest divergence in decades on Newmont Mining & Phelps Dodge and it has been accelerating over the past few months. I believe we are extremely close to an initiation point on my prior "pairs trade" post. So close that frankly if I were a very aggressive trader, I'd be building a position on my pairs trade right now. If it developed constructively, I'd scale further into the trade relatively quickly. It is highly likely we are close to setting up a major break in copper or a push significantly higher in gold or both. I would expect the reasons this trade is setting up are not a good sign for the global economy. The drivers could be one or many scenarios such as a significant global slow down, "abnormal" inflationary pressures as outlined in the October 16th post, "Why The Bulls Are Wrong. Why The Bears Are Wrong. And What Comes Next." or other yet to be revealed issues.

Here are the first few paragraphs from my pairs trading post along with the date it was posted if you missed it. The entire post is available in the site archives.

Sunday, August 20, 2006

Pairs Trading and Phelps Dodge

Finally! Here's my pairs trading post. I believe this strategy will soon make significant sense. It hasn't unfolded yet but sometimes markets don't oblige exactly when you want them to. First let's take a cursory look at pairs trading or more commonly called spread trading. Spread trading seems to have found its beginning in the futures market from all of my reading. I don't know who first developed such a strategy but Morgan Stanley takes some credit for birthing it. The concept involves finding two commodities or investments which are highly correlated. They can be positively correlated or negatively correlated. Doesn't matter. They can be seasonally correlated like heating oil and gasoline or they can be inflation oriented like copper and gold or they can be business cycle correlated like semiconductors and oil companies.

Spread trading is a tremendous opportunity to reduce risk while taking very aggressive positions. For equity investors, I guess something like covered calls or strangles or straddles or some other risk reducing strategy would likely resonate. Using stocks as opposed to futures contracts or options contracts is alot easier and cleaner. You don't have to decide which months to invest in, you don't need to hit the trade just perfectly, you don't have a time decay issue and a host full of other issues.

Per the comment, READ MY DISCLAIMER POSTED CLEARLY ON THE FRONT OF MY BLOG IN LARGE PRINT. I DO NOT GIVE INVESTMENT OR TRADING ADVICE. THE POST IS IN FIRST PERSON. ME. NOT YOU. I QUOTE "The information on this site is provided for discussion purposes only, and are not investing recommendations. Under no circumstances does this information represent a recommendation to buy or sell securities." PER YOUR COMMENTS, THIS WILL NOW BE INCLUDED AT THE TOP OF EACH POST FROM THIS POINT FORWARD. THANKS .
posted by TimingLogic at 5:17 PM

Is Google A Buy?

I suspect I'm the only person in the world who thinks Google is about the worst investment on Wall Street. Making new highs this past week confirmed to those who are bullish that Google will possibly reach its price target of $2,000 given by a Wall Street analyst.

While I am a big fan of Google's culture and their business is doing extremely well right now, one must realize the cumulative competition is growing larger and they are all gunning for Google. We are now hearing people talk about Google free zones on the net, MySpace possibly banning YouTube content from its site and media/content companies waking up to the fact that Google is out to take their business. While competition is nothing new, I'm not talking about competition. I'm talking about valuation. Let's look at a few facts:

@Momentum and technology stock pickers with no sense of equity market cycles will never outperform the markets. The most important criterion in picking stocks is the health of the major markets.
@Google now trades at over 150 times market cap to free cash flow. Exxon Mobil which is up 3,000% in the last thirty years is trading at less than 10 times.
@Google's price to book is 11 and price to sales is 16. Exxon Mobil is 3.6 and about 1.

Yes, I surely understand the differences in growth rates, industry, size, etc. Plead your case to someone else. Finally, there is the chart. I'm surprised that Google actually filled its gap down at its prior high after two prior failed attempts but it finally did. How did it do so? By creating another massive gap below after being jammed higher in premarket activity. So, are we at the start of a new run in Google? Maybe. But, since Google has spent almost an entire year of trendless motion filling about ten gaps including the massive gap filled in the last week or so, is this a major assault upward or the beginning of the end? A false new high? Well, given Google has not filled the gap it just created or under $350 and that gap down at $150, it will be interested if the stock continues on its gap filling exercise. Could we be entering a brave new world where this consumer focused stock is now headed for a market cap to free cash flow of 200? 2,000? Or a market cap larger than the equity market valuation of half of the stock exchanges in the world? All for a company that claims to do one thing?

Remember, Google didn't invent anything. In fact, Google isn't even the best search algorithms out there. I've never heard a single data management expert say Google was the technology leader in search. To the contrary, I have read many technical briefs of companies whose technology is far superior to that of Google. Remember, search is a very, very old technology and there are many brilliant minds in many industries and other companies who have patented significant advances in data management and search.

So, what does Google do better than anyone else? Monetize search. That's it. And while they are printing money as we speak, does that mean Google deserves this level of valuation? Is that single capability defensible when six billion creative minds don't work within the walls of Google? Including most of the brilliant minds within their competency?

Google is currently tracing out the most important characteristic of a topping pattern. Does that mean it cannot go up further? No. Does it mean there is 100% certainty this is a top developing? No. But, I will tell you what is does mean. I'd rather own Exxon Mobil and so would the entire list of the most successful investors who ever graced Wall Street.

Enjoy the ride. Things are likely to get very interesting soon enough.
posted by TimingLogic at 10:11 AM

Saturday, October 28, 2006

The Pickup Truck Economy

While GM, Ford and DaimlerChrysler continue their turnaround efforts, the auto business remains extremely weak. As I've mentioned before, the old adage "as goes GM, so goes the nation" still rings true. While the auto industry no longer dominates the economy as it once did, its economic fingers are massive from suppliers to logistics to transportation to basic materials to electronics to tires to energy to their retail operations. As the entire auto and supplier industry experiences significant layoffs and bankruptcies, the effects will be felt well beyond the first order economic impact and well into consumer banking, real estate, quick service restaurants, retail, consumer durables and more.

But, more than anything, the numbers which are most disturbing are the near collapse of pickup truck sales. While SUVs or other gas guzzlers may be somewhat discretionary and therefore open to substitution, I wonder how much of the full size pickup truck market is. Growing up in a farming and manufacturing community, nearly every family I knew had a pickup truck. From farmers to skilled tradesmen to small business owners to entrepreneurs to construction workers, the necessity of a pickup truck is arguably essential to the economic livelihood of millions of Americans. So, with sales off so dramatically, what does that say about the state of the economy or the paychecks of those who need a pickup truck to sustain their businesses and families? I don't have the pickup truck sales statistics for the 1970s oil crisis but this is an unparalleled collapse over the last twenty five years. I'm a believer that the American consumer is never to be underestimated. Yet, is it possible the consumer is healthy with such a glaring weakness in the sales of a staple product?
posted by TimingLogic at 10:55 PM

Thursday, October 26, 2006

Halloween Came Early This Year

Two posts ago I said this was the last post for the week. That was a trick. And since Wall Street has likely been giving you a trick, I thought I'd attempt to counterbalance in some small way with a treat.

Gross Domestic Product was not very pretty. In fact is was really ugly and so was the breakout data. But, hey, retail sales weren't that bad and the Fed will save us or so the thinking goes. In other words, I guess buying that new purse made in China is going to offset the substantial capex cuts being announced in an already comatose capex cycle. Or how about the CEO confidence surveys which are cratering. I bet that means said CEOs will start hiring more people and spending more on infrastructure given their sentiment which, by the way, is likely backed up by order rates, business activity and corporate economists telling them the business climate is deteriorating. Or the mortgage derivatives market which is pointing to a much uglier housing picture than we are experiencing. It's all good. Or, as the greatest value investor of all time, Ben Graham said, "Wall Street learns nothing and forgets everything.".

You can be quite assured we are not going to get any meaningful sell off before funds close their books at the end of October. Their paychecks matter most. So would yours if you were in their shoes. Plus, in a moment of paranoia, I suspect a little of this rally is a gift to politicians. A Democratic sweep in the U.S. elections would likely mean more Wall Street regulations, more oversight for hedge funds, potential business meddling, possible repeal of tax cuts or tax increases on the top income earners, a slow down in earnings from fat contracts for defense contractors, etc, etc, etc. So, why not do your part to help your fellow Republicans win the election by putting a little icing on the stock market? Enough conspiratorial thinking. I don't want to become too fringe. But, given the unusual underlying dynamics of this market, something unusual is happening.

I think I've only had two posts on here sharing any data from my short term models. Those were my October 3rd and 4th posts. I don't want to turn this into a trader's blog because I believe investors should not attempt to be traders and I don't subscribe to most people hopping in and out of stocks. But since this is a treat I thought I'd share a few graphics. Most of my work is pretty arcane because I don't want my work eroding over time.

The first set of three graphics include one of a suite of data points I use to anticipate a negative change in trend. It is extremely accurate. Does that mean it will always work? I'd hope so given human nature never changes but if everything were a certainty, we'd have our lives mapped out perfectly. If you want 100% certainty, you shouldn't be investing in equities. This is also confirming what my prior post on October 4th showed. That is an environment which does not appear to be a conducive to a continuation of this move up. I've smoothed it with a moving average shown in red since it can be extremely volatile. If it's not intuitively obvious, the graphic should be rising along with the market in a bullish environment. Graphic#1 is the 2000 bubble top. Graphic#2 is the May of 2006 top and Graphic#3 is today. All three are displaying the same algorithm.

Graphic#4 is a current chart. This is obviously a different algorithm. It started falling off of a cliff a week ago. Not that it was exactly bullish before last week. It is not smoothed but you can easily visualize there are no higher highs and higher lows. The direction is down. That it accelerated last week is not a good sign for the intermediate term.

Pricing action on all four charts is the NDX or Naz 100 which is my favorite proxy for the short to intermediate term trend. Remember, there is no magic bullet in life but with my long term models on sell and with some of my short term work falling off of a cliff, it would take an act of God to have me allocating capital to equities over the last few weeks. In addition, some of my other short term work shows some really reckless action started two weeks ago. The last thing I ever want to do is be one of the reckless crew. It's all about capital preservation, safety based investing and risk management. Now is a time to be defensive.


posted by TimingLogic at 7:10 PM

Wednesday, October 25, 2006

Ok, So Shoot Me. I Lied.

One more post this week taken from the comments section. I think it deserves timely front page notice to be taken into consideration along with my last post about the Major Market Index running off of a cliff. I suspect I know who posted it but since it's anonymous, let's just paste it here. The poster can claim credit if they want to.
Anonymous said...Dow briefly passed the 3rd Standard Deviation above the 200-Day m.a. . for the first time since March of '98 , and only the 6th time since 1990
So, what does this mean? It means you shouldn't be taking risks because the market is delirious. I remember March of 1998 quite well. 1998 was a year of fine wine and delirious lunacy as well. In case you don't remember 1998, it was a great year for small caps. The Russell 2000 dropped 40%. There were some minor trillion dollar problems that year. If you'd like to relive that time and be reminded of that little problem, click HERE for one of the best videos you'll ever watch. (The QuickTime link is best for Firefox users if you have it installed on your PC. The other link might lock your browser. No QuickTime, I'd assume you could use your Explorer browser and click on the Microsoft Media Player link.) I think this is an outtake from a Frontline documentary you can order on PBS.com as I recall. I just so happen to know the link because I've watched this more than once. A humbling reminder since these guys were geniuses and were destroyed. Leverage is a risky scheme even the brightest minds on Wall Street should respect.

A bit of trivia. The white haired man with the beard in the video is Stan Jonas who is a mathematician and likely one of the most brilliant people on Wall Street. If anyone knows Stan, please alert him to my blog and tell him I'd crawl on my knees for a chance to work for him for free just to be able to learn from a legend. He's at Fimat the last time I checked.

So, why is this timely? Because it is about real estate plummeting and financial market consequences. Sound familiar? My earlier post on the largest drop ever in American real estate this past month, posts highlighting financial institution risk in this cycle and comments about the mortgage derivatives market . No, I'm not saying that is what is going to happen so don't misinterpret my comments. But financial markets don't always reveal unusual behavior in advance. We sometimes only know the reason after it happens. This move in mega-caps is highly unusual per the comments by the anonymous poster and my prior posts.
posted by TimingLogic at 7:24 PM

My Advanced Pattern Recognition Engine

Two posts today. That means likely no more for the rest of the week. Now, I have to preface this posting with a few comments. I've probably looked at well north of 100,000 charts in my life. I did a little mental calculation and it might be as many as 500,000 charts I've looked at.

So, I've got this extremely sophisticated pattern recognition engine which alerted me to the chart below. This pattern recognition engine is the most advanced machine on earth for doing this type of analysis. It's better than anything developed in the labs of IBM, HP, Intel, Microsoft or if you like wildly expensive labs, Google or Apple. That pattern recognition engine is the human brain. It's an amazing invention so be sure to use it! Yours, that is.

Below is the chart of the Major Market Index. A little known index which is basically the twenty biggest publicly listed companies in the U.S. Remember what I said yesterday? The top 50 or so megacaps are driving the market. Longest run without a 1% intraday correction in half a decade. Last two times something similar happened we saw stocks crater. And what have I said for months? My models are still on sell (Or defensive if you foolishly choose to stay fully invested this cycle. Just an opinion not investing advice.) And that topping is a process and nothing in my work has proven to be anything other than expected topping action. Now, I'm not going to share my work but as I've said, I will share publicly consumable information to make you a better investor and assist you in managing your own finances.

Ok, the only time I've ever seen a chart like this is when a company has found the proverbial cure for cancer or topping. We all know the top twenty stocks are dull lethargic companies so they aren't cumulatively finding the cure for cancer. Of course, another explanation is we are experiencing hyper-inflation but gold isn't confirming that and neither is the dollar. So, I guess we can put the conspiracy theories analagous to the Weimar Republic on hold.

The moral of the story? If the market is going somewhere in a hurry without a breather, it's best to wait to see what the hurry is. Eventually, the circumstances will reveal themselves or a better opportunity to buy will emerge. Risk management/discipline are keys to long term investing success. Are we exactly done at this moment? Well, some of my short term models fell off of a cliff late last week. So, maybe we are and maybe we aren't. Maybe we'll float around for a month or three or maybe we'll start to see distribution after the close of books at the end of October. I don't know what tens of millions of investors are going to do tomorrow but we reached or will soon reach our target of 1360-1400 on the SPX and that means many shrewd traders are pulling in their horns. Enjoy the ride. We're going to Dow 36,000!

posted by TimingLogic at 12:24 PM

Tuesday, October 24, 2006

Real Estate Is A Global Problem And It Isn't Going Away If You Wish Happy Thoughts


Update: NEW HOME PRICES DROP TEN PERCENT: Most In 35 Years


When I hear the perma-bears launch into how the American consumer is irresponsible, never saves a penny and is, by constant inference and innuendo, a complete buffoon, I zone out. How often over the last thirty years have you heard that while wealth, economic prowess and technological leadership in the US has exploded by every measure?

The latest attempt to label Americans? Housing. Ultimately, everyone is right if you stick with the premise long enough. While I believe global real estate is a serious concern -U.S. home prices dropped the most on record this past month- it appears the American consumer is once again at the top of the buffoon list. Yet, is that really true? Of course not. Central bankers everywhere made the same moves to stave off the threat of deflation post 2000 setting up the same response by every greedy global investor and practicing capitalist.

The difference between the U.S. and other real estate fiascos? The U.S. economy is the engine for global growth and almost solely responsible for the Chinese miracle-less miracle. (The real miracle is that the U.S. has almost single-handedly consumed everything 1.3 billion Chinese can make. Or, at least they have so far.) The real estate problem is a global one and the consequences, whatever they may be, will be felt globally. The only reason the world is focused on the American incarnation is that if we go down, we are taking them with us. If Australia or Spain or England or China real estate craters, it will have a nearly nonexistent impact on the U.S. economy.

By the way, why are we in this global predicament? I'll gladly tell you why. Because the global economy is and will remain synchronized. And why is that? Well, here I go again with the same incessant rantings over and over. Because other than Great Britain, Canada, Australia and to a lesser extent a few other countries, no one else on this earth appears willing to address domestic reform needed to stimulate their own economies. They'd all rather shove all of their ouput down our gullet than deal with painful reform. What is the impetus for reform when countries happily enjoy great export booms to America? A little bit of dysfunctional relationship dynamics there in failing to address their own problems, heh? So, how about a very different perspective on the current global dynamics? It's not the U.S. consumer who is the buffoon. It is the international politicians. The reason all countries are at such high risk for a slow down is the fault of nearly every country other than America. That's right. As I've said many times, six billion people rely on 300 million Americans for their prosperity? International politicians don't see an eventual problem arising from that dynamic? If other countries would undertake reform, a slow down in America wouldn't have such a disproportionate global impact because the economies wouldn't be so synchronized. Under such a scenario, as one economy cools, the remainder of the world could pick up the slack. Oh well. There will be a day of comeuppance. The only question is if that day is tomorrow or a decade from now.

Below is an excerpt from a Finfacts article posted on Monday re the Irish housing market. It's just the latest housing report from nearly every corner of the globe. It's a little unnerving to see such a significant global issue developing. Oh, and central bankers do not have the capability to stop this situation either. More on that later.

The outlook for the Irish housing market is a subject that is never far from the minds of the general public as well as the government, the Central Bank, the IMF and indeed, those involved in other sectors of the economy who question if a housing market crash could occur and what impact it would have on the economy as a whole. Average Irish house prices have almost doubled over the past six years while cumulative house completions have topped the 450,000 mark over the same period. The housing sector has directly accounted for one-fifth of the cumulative growth in real GDP of 36% since 2000. Construction employment now exceeds 260,000, representing 13% of the total workforce. Mortgage credit has more than doubled over the past three years and personal sector indebtedness now exceeds 150% of disposable income. Residential property related household wealth, however, has grown from €450 billion in 2003 to €700 billion in 2006.“


posted by TimingLogic at 11:16 PM

Is This As Good As It Gets?

If this is the start of a new bull market, I'd say the investment pickings are mighty slim. Fifty of the largest stocks likely comprising more than 25% of the capitalization of all US stocks that are driving the Nasdaq, the S&P and the Dow?

Now, I'm too lazy to validate what I said but take it in context. The numbers don't need to be accurate, the generalization does. I don't know what the market cap of the top 50 or so megacaps is but I would guess it to be an average of $100 billion in market cap. That would make their cumulative weighting around $5 trillion. Now, I'm guessing the thousands and thousands of shares listed on the three American exchanges plus the pink sheets probably have a capitalization of less than $15 trillion including those megacaps. So, if money is flowing into the top fifty companies and most everything else is not confirming, how do we define that has a start of a sustainable new trend? I'll tell you how. It's called new math. Or for those who never took math, it's called witchcraft and ouija boards.

Below is the advance-decline line for the Nasdaq over an approximately three year period. We are seeing less participation with each successive rally in stocks over this time line. ie, Down is bad, up is good. And how again is this bullish? Oh, I forgot. The advance-decline line doesn't matter anymore. That's right. Enjoy your new bull market and be sure to double down because you are surely holding a winning hand. And, what have I said repeatedly? It's all about risk management. Are the odds in your favor?

@Closing in on the longest run this cycle without a 1% intraday correction on the S&P. Each other time followed by a significant selloff.
@Weak buying pressure this move
@Homebuilders not confirming the gibberish of a soft landing
@Mortgage derivatives market pointing to a hard landing
@Weaker and weaker advancing issues
@Most cyclical earnings in half a century. ie, They could implode if we get a slowdown.
@Inverted yield curve
@Still hawkish Fed
@Tightening money supply
@12 of 14 times the Fed raised rates 3x or more ended in recession
@Negative cycle for capex
@Negative real wage growth
@Underemployment
@Small caps and Transports at bubble levels
@As many as one in three jobs created post 2000 in the real estate, retail or mortgage business. ie, Buy the home, finance the home, furnish the home.

I could type forever but you get the gist. Risk management.


posted by TimingLogic at 9:42 AM

Sunday, October 22, 2006

The Banking Sector And Structural Risk

"Our overall results continue to benefit from a favorable credit environment, which we do not expect to continue. We continue to focus our business planning around a return to normal or even adverse credit conditions across all our businesses," - JP Morgan CEO Jamie Dimon in a recent press release.

I've written about the banking sector a handful of times in the last few months including the fact that the May top was the likely top in the Philadelphia Banking Index. While I offered up a possible marginal new high of approximately 116, we still have made no progress against the May top. In fact, we are marginally lower than the May top. Markets rising without the banking sector are very suspect. That isn't an opinion. That is as close to a fact as one will get.

If there was ever a time in the last thirty years to steer clear of financial institutions as investments, I believe today is that time. We have numerous long wave forces combining to create a potentially destructive cycle for said investments. While I realize banks are considered a decent value play because they are sporting dividends of 3-4%, one must realize banks are not defensive investments. One more time. Banks have never been and will never be defensive investments. Because I firmly believe man is inherently prone to foolish endeavors, banks and consumer financial institutions are in need of special regulation to protect our savings and investments. Time and again banks have proven their perfect fallibility by practicing unwise risk management, investing in unsound schemes and making foolish decisions with our savings. In prior cycles they have made unwise investments in energy, unwise investments in real estate and unwise investments in business on grand scales. And, since bankers also exhibit group-think behavior, they tend to all make the wrong decisions at the same time thus increasing the potential and magnitude of a "mess". In fact, the reason we have a central bank is in large part to be the rock we can count on when bankers make foolish decisions and jeopardize our savings. While central banks should really be proactively keeping banks from getting into unsound investments in the first place, central bankers are prone to fallibility as well.

While some people believe the 2000-2002 bear market was the worst in history, that simply is not the case. It could have been the worst bear market in history except for central banker attempts to stave off disaster by fueling credit expansion which, when undertaken in a business recessionary cycle, is allocated into the consumer sectors. So, what we have experienced is likely an equally serious equity bubble in the consumer sectors developing from 2000-2006.

Economics seems to be a form of voodoo for many but it's really a very simple social science. I like to use visualization as a method of explanation to help people understand a concept. The cycle pre-2000 was a positive expansionary cycle. That means the consumer sector and the business sector were positively synchronized. Using an ocean wave to explain the concept, we had two very powerful waves form to create a double sized positive wave. Post-2000, left unattended, we would have had a synchronized downturn where both business and the consumer sectors combined to create cumulative wave of destructive or cleansing power of the imbalances created over a long wave expansionary cycle. Instead, global central bankers injected significant liquidity and credit into the cycle. As economic theory would substantiate, that investment would be directed into the consumer sector as I alluded to in a prior post. What ended up happening post-2000 was we had two waves colliding. A negative business cycle wave and a positive consumer cycle wave from 2000-2006. Think of two waves moving in opposite directions on a collision course. Generally, these two waves would cancel each other out as they collided. But, with the consumer sector being the larger of the two, we experienced positive growth but stagnant wages as we would expect in a business driven recession. What most people don't realize is that we are still in a business recession but we are in a consumer expansion.

So, just as happened in 2000 at the end of a positive expansionary cycle in business, we are likely entering an end to an approximately seventeen year positive consumer cycle. Thus, this cycle has the potential for both the ongoing negative business cycle to combine with the start of a negative consumer cycle to create an additive negative wave. In other words, the purging cycle. A cycle with the potential for tremendous capital destruction. ie, Don't expect to see consumer stocks bucking the downward trend as we saw post-2000.

To me it's rather hilarious to read of the Intel, Microsoft and Dell bashing so prevalent. This shows a clear lack of understanding of basic economics and why cycles occur. It is not a coincidence I have written positive posts on these three companies in the last few months while being very dour on stocks in general. The next positive expansionary cycle will be led by business not by consumers. These three companies will be amongst the leaders where capital will be heavily allocated both from a business perspective and an equity market perspective. I do not like any of these companies as investments today but it is no surprise they are rising contrary to those dumbfounded that these dead companies are acting positively. In fact, since writing about these three companies, I believe all three have been three of the best investments on Wall Street. Before my musings, they were the biggest dogs on Wall Street. It isn't because I'm clairvoyant or brilliant. It is because I have a relatively strong grasp of both short and long wave cycle theory and most on Wall Street don't even acknowledge long wave cycles exist. Or, at least the ones trotted out for public consumption don't. Many do but you don't get the luxury of their opinions. They are too busy setting strategy and making billions. Might I add in summary that those who are buying these three companies right here are betting the Fed will save the economy and that positive expansionary cycle is right around the corner. They are likely very wrong.

So, you may argue that AMD or Apple are also business driven stocks and they have flourished this cycle. To the contrary, AMD is a consumer oriented company. Their desktop & mobile solutions have not cracked the corporate market one iota. Yet. Ditto with Apple which has nearly zero penetration into business. So, if you understood the current cycle, you would be long AMD & Apple not Intel. Or, long AMD or Apple and short Intel as a pairs trade post the technical impulse rally in semiconductors in 2003.

That AMD is reflective of the consumer and is showing continued weakness is not a positive sign for the general economy. One might argue as I had written prior that Intel's new products are hurting AMD but the reality is more likely that AMD weakness is reflective of a negative consumer cycle starting soon. In fact, quietly AMD is headed back to retest its post-May selloff lows as Jim Cramer and others tell you to load up on semiconductors. While I came pretty close to calling the exact peak in Apple then the subsequent rally, I would be extremely surprised if we would not start to see Apple develop sustained weakness as it retests its prior highs. My work shows continued underlying weakness in Apple regardless of this retracement rally.

In summary, the banking sector poses significant risk as we have the potential to enter a cumulative downward cycle. We are likely entering a cycle similar to 1974 or the mid 1930s. I'm not calling for another Great Depression but rather the synchronization of negative cycles. We may have a mild recession or we may have a situation where something more significant develops. There are simply too many constantly changing variables to determine the global economic future. I prefer not to hold through such a cycle without any clarity of where we go from here. In a positive or mixed cycle slow down, I would allocate capital to defensive sectors and sectors I deemed the beneficiary of future liquidity injections but not here. I'd rather garner a guaranteed 5% than to take undue risk.

The markets are shunning risk right now. So, do you want to heed the words of Jamie Dimon, the action of the banking sector and the action of the Generals or are you ready to declare the mid-cycle slow down "beaten" as many on Wall Street and the media would have you believe?

Investing is not gambling. Risk management is the key to your long term success.
posted by TimingLogic at 2:43 PM

Friday, October 20, 2006

Final Thoughts For The Week

So, it appears we've dodged a bullet. The Fed gets tremendous accolades for engineering a soft landing. The Fed is indeed omnipotent. Today on the tube I see a long time bear who has thrown in the towel. It's hard to argue with the earnings being reported was his parting comments. A few of my favorite bloggers have recently attempted, in vain, to keep people grounded.

Well, I'm *hoping* the bullish perspective is right but I don't invest based on hope. As I've said before, I learned long ago not to attach too much weighting on what others tell me. Some call that cynical. Others negative. I generally find it to be more about finding the truth. Truth they likely don't have. How often have you been told that something couldn't be done only to find out it surely is possible? Or that something is surely a truism, only to find out it isn't? I see their data. Target, Wal-mart and other retail stocks at 52 week highs and good retail sales still being reported. Now, lets look at my data. This is how I measure retail stocks. Unfortunately, my data looks a little different than their data. This chart is from February 2003, the start of this bull market, until today. Who is on the right side of the trade?

I guess the next few months will give us some clarity. At least some short term clarity. In the mean time, be sure to go out and spend some of that hard earned money to support the global economy.

posted by TimingLogic at 2:08 PM

Monday, October 16, 2006

Why The Bulls Are Wrong. Why The Bears Are Wrong. And What Comes Next

I decided to post snippets of my cycle theory. If any of you have read my prior posts or rants on other blogs, components of this will resonate. Much of my cycles work is a result of my frustration at the incoherent and incomplete ramblings of those who were supposed to know yet clearly didn't. You get free snippets. You want the whole treatise? Cough up five or six figures and I'll give it to you. Or, hire me as your chief investment officer and you'll get more detail. This will probably be my only post for a week or so since my forearms and fingers hurt from typing so much. You must remember this is a hypothesis which I believe has substantial supporting evidence. Much of what you will read is based on sound economic theory and generally accepted monetary policy theory. Does that mean it is a totally accurate hypothesis? Well.....I don't even believe we can necessarily prove 1+1=2 has any merit as a universal truth anywhere except in our mind let alone our unwaivering faith in advanced science so..........

Every single asset in the world is synchronized over this cycle. Real estate, equities, global equities vs domestic, bonds, commodities and cash rates all moved in the same direction. Why? Because the global economies have effectively outsourced monetary policy to the U.S. with dollar denominated global trade in commodities and, in China's case, a pegged currency exchange rate. What does this tell you? Well, there are many potential interpretations but don't expect this to last. At some point the markets will decouple. In any event, so far it's a good thing. For now, it's a brave new world and there is no need for asset allocation as a hedge. This cycle you just buy all of it and enjoy the ride.

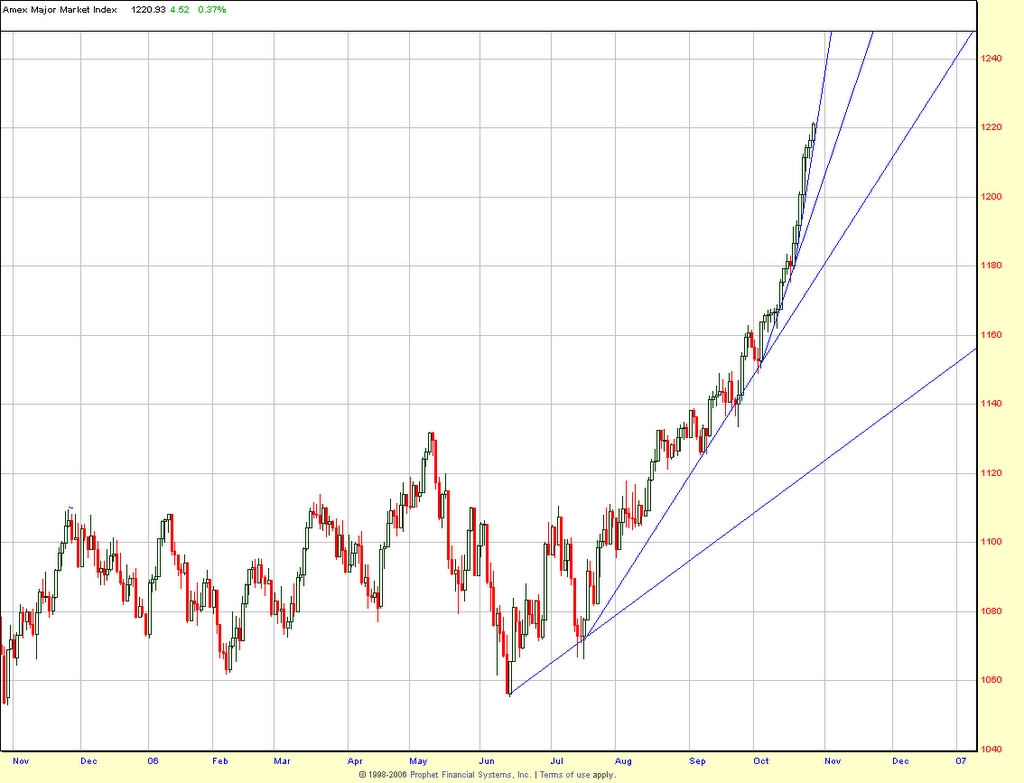
Along those same lines, we really started to see an expansion of the market into this cycle's leaders over the last two weeks. Prior to that, the 2002-2006 leaders had been dogs during this recent climb. Oil, transports, energy, metals, etc. The exception was broker/dealers which as an index had tested its old high before dumping pretty hard this last week on an earnings disappointment. Individually Goldman is up 23% in a month and pierced its old high. This was done on some pretty heavy volume which was no doubt helped by short covering. Shorts have had a fascination with broker/dealers for over a year. I actually remember a hedge fund manager on a financial channel who had shorted Lehman, as I recall, and was crushed on a fantastic earnings announcement a while back. That same hedge fund manager has been bearish for a few years now. I believe he will likely have the last say but his premise is wrong. In fact, the premise of most bears is totally wrong but they will likely be proven right for the wrong reasons. There is no doubt the bears got ahead of themselves over the last few months. I would be extremely surprised to see Goldman move much higher here as it is now sitting right on a long term resistance line. Here's a question. Is Goldman's trading desk allowed to buy its own stock and ram the shorts? I would assume that is somehow forbidden but I'm not an SEC attorney and these issues haven't historically been worth pondering. That is, before your banks were allowed to trade against you in the markets.

So, what we have over the last few weeks is an expansion to this cycle's leaders as well as the expectation of next cycle's leaders rising. There's no oil/semi play anymore. It's long oil and long semis. It's long everything. Buy it all! Even homebuilders. Valero, one of my most beloved stocks this cycle yet one of my most hated stocks for the last six months hit a short term buy a week ago if I was so inclined to trade its volatility-which I am not. It's an extremely attractive stock as long as the market is going higher in my estimation. Even if oil sinks further. So, why an expansion of breadth to include those stocks? Well, it could be many things. It could be a general feeling of confidence amongst investors to nibble on cheaper leaders as the market goes higher. It could be that the Fed is pushing a little more money out the door and dollar denominated commodities are rising in sympathy but I doubt it because the dollar is strengthening. Or, it could be that the global economy really isn't feeling much of an effect of higher rates and our old friend inflation is rearing its ugly head. Or, it could be all of the above.

My vote? We have sold off in anticipation of awful economic data. That is part of a normal topping process. And, yet, so far there is little awful data. You must remember that the market leaders peaked six months before the market started selling off in 2000. That would put us at a very risky time into November and December. As I have said repeatedly, topping is a process. not a date and time. Am I surprised the mega caps made new highs? Yes and no. But, since they are the most defensive and undervalued stocks, ultimately no. Back to 2000. What caused the market to finally sell off in 2000? The bulls had to actually see they were wrong. The data had to confirm. Today is no different. There is "not so good" data and "reasonably moderate" data. There isn't really any data truly confirming the economy is headed for a hard landing in the economic reports. Yet. Don't get too excited about earnings. You must also remember earnings grew at a faster pace in the 1970s than in the 1990s. But your reward in the 1970s was a zero percent return (not including dividends) for equity markets from peak to peak.

So, let's take a look at what is next. There are three scenarios we have to contend with on a go forward basis.
@The economy re-accelerates
@The economy muddles through
@The economy craters

First, if the economy re-accelerates. What can we expect? Commodities will likely mount another assault higher. The dollar will likely weaken or remain limited in its upside. The current account deficit will continue to rise beyond its already unprecedented 5% of GDP and eventually the Fed will have to raise rates putting more pressure on stock valuations and the economy. Stocks, already massively overvalued by any measure, receive more pressure from global central bankers as they raise rates. The S&P with a dividend yield mighty damn close to zero competes with guaranteed investment returns of greater than 5% and rising. The Transports and Russell 2000 with PEs as extended as the S&P in 2000's bubble and no dividends to speak of, become even more of a high risk holding. Do you want to pay for 35 years worth of earnings with no predictable cash flow and dividends?

Second, the economy muddles through. Or, if you are a perma-bull, we walk hand-in-hand with goldilocks. Earnings go up forever to unprecedented levels as a percentage of GDP, long rates remain in check, commodities abate significantly and we likely remain somewhat range bound with more of the yo-yo action we've experienced in 2004-2006. In this scenario the bias would be mildly to the upside in equities because of strong fundamentals yet the valuations would likely limit the upside potential.

Third, the economy slows significantly. There are two possible scenarios here. a) The Fed cuts rates immediately or b) The Fed keeps rates as is. Now, you may ask why the Fed wouldn't immediately cut rates. Well, it's pretty simple. Sans the conspiracy pundits who would have you believe the Fed is out to ruin the American way of life and the dollar, the monetary policy of the Fed is much different than it was in the 1970s. There was a general awakening amongst central bankers as to their mistakes and how they contributed to the malaise and eventual runaway inflation during that period of time. The Fed today has not repeated the mistakes of the 1970s. Yet. I've commented on here that I am actually very glad Ben Bernanke is leading the Federal Reserve through this time in our economy and I truly believe that. But, that doesn't mean I believe the Fed is our savior. Forget about the lunatic fringe and their position. They are always wrong for the wrong reasons. Even when they are right, they are right for the wrong reasons.

So, when the pundits tell you the Fed is going to save the day by cutting rates, I believe that exposes a general lack of understanding of cycles, economics and intermarket analysis on their part. The Fed is not a miracle worker. If they were, each time the Fed cut rates, we would make a new high in the equity markets and we'd all be retired. Instead we spent 50% of the time over the last century retracing old highs. The reality is there are cycles when the Fed really has little power other than to make the economic situation worse. I believe we are now at that precipice and I believe the Fed understands this by their recent hawkish statements. And, what am I referring to? One can easily see that capex spending has been in a depression since 2000 as I had written in a post some time back. But, why is this? Because I believe we are in an innovation depression. Business is the driver of innovation not the consumer sector. Business innovation trickles into the consumer sector as we have seen with Apple, video games, etc, in this cycle. Evans & Sutherland was building sophisticated video games for the military twenty year ago when I interviewed with them for a research position. They were just as sophisticated as today's games but they cost hundreds of millions of dollars. And for those of you who believe YouTube and MP3 players are major transformational innovations, might I recommend you never invest in technology for the long term. Streaming video and MP3 technology in usable form is as old as dirt and you are driving your car looking out the rearview mirror.

Before you panic, innovation is a cyclical process just like every rhythm in this universe be it your heart, the stock market, the seasons, time and everything else imaginable. We've been here before and the world didn't end. So, what happens when we hit this type of cycle? There is a lack of demand for money by business. And, where does money go when we are in an innovation winter? Why, low and behold it flows into the consumer sector as economic theory 101 would tell you happens when business enters a recession. And what happens when the Fed adds liquidity into this type of cycle with a lack of monetary demand by business? It sloshes in the system without any productive business-to-business demand. So, with a lack of demand and too much supply what happens? The dollar drops in value because there is too much money just as anything drops in value when there is too much of it. And, what does that mean? You need more dollars to buy dollar denominated commodities. So, what happens to commodities? They go up in price. Not because China needs more commodities but because it costs more dollars to buy dollar denominated assets. And, since the business innovation leaders aren't innovating, where does Wall Street investment money go? Into consumer stocks as economic theory 101 would tell you and into commodities and hard assets which now require more dollars to purchase the same unit of material. Simply put, the rise in commodities is exacerbated by monetary phenomenon and the resulting excess cash Wall Street puts to work more than anything else. Didn't you ever wonder why it was post 2000 when the dollar started cratering that commodities skyrocketed and not when China was actually growing at a faster pace years before? And, since we are in an innovation depression, where does excess business cash end up? Mergers and acquisitions, share buy backs, investment in emerging markets and into economies where a disproportionate share of wealth is derived by rising hard asset prices. And, what do we hear from the pundits during these cycles?

@America is losing its competitiveness.
@Generalized bashing of American technology companies and business innovators as past their peak dinosaurs.
@America is kaput.
@China is taking over the world.
@We are running out of oil.
@We need China to change its trade policy.
@We need to slap tariffs on Chinese goods.
@We are slaves to China as they now hold our debt.

Sound familiar? How about the "American consumer-centric" Japanese economy in the 1970s? How many people understand this? Well, since it's my thesis, I know of no one. Although I surely understand that hardly an original thought and others before me or around me have likely hypothesized a similar thesis but I've never met anyone or read any such thesis. But I suppose nary a soul on Wall Street and very few economists have developed such hypotheses. Why? What does Wall Street or economists understand about business and innovation? Nothing. They are in the staid business of pushing money around or dialing their economic knobs.

What created the bubble in 2000? It wasn't the Fed per se. It was the culmination of a massive innovation cycle leading to tremendous productivity gains, new business processes, new transformational technologies and new inventions in business. What fueled the blow off rally? A fractional reserve banking system where massive wealth creation fueled a self-fulfilling massive credit creation just now peaking. It wasn't the Fed flooding the money supply per se as the conspiracy theorists would have you believe.

Without a strong innovation cycle and without upward pricing pressure in the business-to-business economy, the only way to create permanent inflation is via destructive central banking policy as happened in the 1970s. Normal inflation starts in the business sector not the consumer sectors. ie, The only way to create permanent "abnormal" inflation in the current cycle is to debase the currency via unsound monetary policy. So far, we have not seen that. Yes it is true the Fed did aggressively stimulate the economy post 2000. But by then, the innovation cycle was over and they aren't rampantly printing new money either.

So, let's look at the two scenarios of the "savior theory" of the Fed cutting rates in this cycle. a) They cut soon. Well, the Fed can create more money but, they cannot direct where it will go. So, with commodities already extended upward in price and with weak demand for money in the business world, what would happen? If the Fed pushes on the accelerator too much, they could start to debase the currency. What would happen? We would see commodities kick higher as they did post 2000. Maybe significantly higher. Maybe $100+ oil depending on how hard they step. Believe me. The Fed understands this simple concept. Or b) The Fed does not cut rates immediately but waits for commodities to return to relatively normal levels as they sop up liquidity and, hence, the driver of inflated commodity prices. The economy sinks without excessive stimulus as the business cycle continues its innovation depression and the consumer sector, which enjoyed the benefits of liquidity over the last few years, joins in for a wholesale slow down and cleansing of the system. Should the Fed proceed with raising rates before such an outcome, we will see a resurgent rise in commodities and a continued yo-yo of likely shorter and shorter economic expansions followed by contractions until we culminate in a future cycle at some point where upward pressure caused by the next innovation cycle and resurgent demand for business investment and extended commodity pricing work harmoniously to truly instigate real and sustainable inflationary risks. This is likely what happened as Paul Volcker needed to apply brute force to the system as the business economy finally recovered and started its march into the next long wave positive expansionary cycle.

So, in conclusion, the Fed is not your savior. The Fed does not drive the economy. Expectation of lower rates is fraught with risk. And, at this time in the cycle, the Fed is at a time of most significant decision in the last thirty years. What will the Fed do? Given the proclivities of politicians and ongoing elections, it will be very interesting. And, don't underestimate the Fed's knowledge learned from prior cycles. Does that mean they will do the right thing? Well, what is the right thing? We might find it hard to build a consensus. Is it jobs? Letting the excesses purge? Price stability? More muddling? At the expense of debasing the currency? We likely cannot have happy endings to all cycles. And, in the end, what does all of this likely mean for the global economy?

@The finance industry has likely peaked as I outlined in a prior post.
@Insurance companies are highly risky regardless of their dividend.
@Financial institutions are highly risky right now regardless of their dividend.
@Banks are highly risky right now regardless of their dividend.
@Consumer stocks, especially cyclicals like Apple & Google, are where large cap technology was in 2000 and are highly risky right now.
@Anything other than megacaps with high dividends and price-to-book ratios of less than two are highly risky.
@China is living on borrowed time without major democratic reform which is the only way they will transform into a consumer driven economy.
@Commodities are likely going to be extremely volatile but are ultimately living on borrowed time if we have a responsible monetary policy.
@Your emerging market portfolio is living on borrowed time unless they are transformational, reform oriented and democratically driven economies.

The next positive, expansionary innovation cycle will be driven by the business-to-business sector and China is an economy built entirely on feeding the American consumer. Its cycle is not tied to global business-to-business innovation but to the American consumer. And who will lead that next innovation cycle? Clearly and undeniably the U.S. and to a lesser extent, Europe, Canada, Australia and Japan. So, in that end state, what is China's role? A worthless currency as the Politburo attempts to stave off ultimate crisis followed by a deflationary depression leading to social instability resulting in the final collapse of communist China followed by a rise of democratic China? Whew, that's quite a run-on sentence. I don't know for certain and neither does anyone else. But, I do suppose I would be scratching any names off of my potential investment advisor list if they were recently telling you to invest in China or countries benefitting from China's expansion or telling you the Fed is going to save the day by cutting rates. In either case, they are likely wrong. Very wrong.

It's good to have a generally bullish bias as markets do. It's bad to be bullish for the wrong reasons. Ditto on the flip side. America is not losing its competitiveness. It's massive research investments are preparing the foundation for the next major innovation cycle where we will likely experience innovation beyond most people's imagination. So, here's the $64 question. When is the next expansionary innovation cycle? 2007? 2011? 2015? 2050?
posted by TimingLogic at 5:01 PM

Thursday, October 12, 2006

Friday The 13th

A fitting date for the month of spooky equity market occurrences, Halloween and our eery rally. We reached the rally upside target of 1360 on the S&P on Thursday. I had mentioned in a prior post we had hit it last week but I was wrong. The upside target is taken by evaluating the correction pattern and from the double bottom created in the S&P extrapolating that distance to the upside. I had mentioned a month or so ago that I expected the upside to be 1360-1400 if we broke to new highs. 1380 is the last remaining major Fibonacci retracement level on the S&P between where we started and the all time highs set in 2000. I'm guessing that the Generals are actually shooting for 12K on the Dow. A nice pretty number to cheer about. It may be hard to believe but this is the weakest rally in five years by nearly any measure. Now, that said, when the markets charge this hard without normal breathing, it is typically an eventual pump and dump. The only other times in the rally post 2002 we had a rally this long without a 1% single day correction was at the end of 2003 when technology then cratered sending the SMH down 40% into its current bear market and, secondly, a few months before the May sell off this year.

While the three Dow indices-Transports, Industrials, Utilities-are all very narrow, comprising only a handful of stocks, the Dow Composite gives a better measurement by including the 65 stocks in all three indices within a reasonably equal weighting. Thus, I prefer using the Dow Composite as opposed to each index. So, for all of this fussing, we are back to May levels.

posted by TimingLogic at 6:10 PM

From 52 Week Low To 52 Week High In ....... A Few Weeks?


Yesterday the world was ending and today we hear more gibberish about goldilocks. I don't know how many times I repeat myself but there is no such person and there never will be. Ever. Not with greater awareness. Not with improvements in technology. Not with greater understanding of economics. Never. And while I realize never is a long time and never say never and on and on and on. I do mean never. A fractional banking system, a central bank and human nature amongst other things will always spoil the party at some point. That doesn't mean we won't have parties. We'll likely continue to have lots of great parties. It just means they won't last forever. There will never be a goldilocks economy.

The market has become very volatile for specific sectors. One of them is retail. Recently many were at or near 52 week lows. Bebe, Coach, Target, Wal-mart, A&F, Gap, Urban Outfitters, Guitar Center and on and on and on had been routed. Coach, a tremendous brand as an example, had dropped from near $40 to the mid twenties in about three months. At that pace? Zero in another three months. Yeah, that's sustainable. Now, we whip back in the other direction in a matter of weeks. Some retailers are up 60% in that time frame. 60%! Annualized rate of return of 500% or more! Yeah, that's sustainable too.

So much for efficient market theory. The first thing you should realize is most people on Wall Street don't really know any more than an informed individual investor. If they did, we wouldn't be seeing the market action I am writing about in this post. If they did, we wouldn't have seen stocks lose $13 trillion in value post 2000. The sooner you realize this, the better investor you will become. Why? Because you will start to question the gibberish everyone wants to feed you and start to educate yourself and pick advisors or investments which have a positive track record in good times and bad.

Back to retail. Target has gone from a 52 week low to a 52 week high in a matter of weeks. In the process, it has been rising at an annualized rate of return around 250%. Bear markets are exemplified by fast and furious rallies. But we are not in a bear market you say. Well, only hindsight will tell you the answer to that question but I am more confident than ever this is a topping process for what will likely be a significant top. Why? Not opinions or guesses. Measurements and models. So, what happened with this August to October rally? Well, I'm too lazy to check all of the stocks but I would assume there was a rather healthy short interest accumulated in retail amongst other places. I suspect so because one of my long term holdings went ballistic after being very weak earlier this year. Why? Short interest in the stock built up rather substantially and provided a pleasing reward to short killers.

You must always remember that the Generals are a potent force regardless of whether the market is going up or going down. So, I would guess this rally was about the Generals teaching some hedge funds and brash short sellers a few old tricks. Have the fortunes of Target, a $55 billion retailer, changed enough to warrant a continued assault at this pace? Oh please you know the answer to that.
posted by TimingLogic at 12:30 AM

Wednesday, October 11, 2006

The Monkeys Are Now In Charge

Ok, it's official. Cramer comes out last night and tells people to scrap defensive stocks and buy semiconductors. (No I don't watch it but I must admit he has a great sense of humor. I was channel surfing late last night and his cranial vault passed by. So I stopped to admire the shine.) The monkeys have obliged and it appears they are now in charge. A correction of some sorts is imminent. If you are a bear, this might be the start of something bad. If you are a bull, it's just another natural rhythm of the market. If you are smart, you might consider waiting to find out how bad it gets before backing up the truck. Again, with the caveaut this is not investing advice.
posted by TimingLogic at 1:16 PM

Tuesday, October 10, 2006

Tis A Brave New World

As advisors such as Don Hays sound the trumpet what are investors to do? Join the parade at 90% invested in stocks? Hmmm? Some direct quotes from the article link above:

"The next few decades are going to witness this massive and wonderful build-out phase of the Technology Revolution, which means heightened Productivity and spreading Democracy. "We are entering this stage with massive negativity ... of course. With the S&P 500 the most under-valued of any time in the last 30 years.

"No one ever believes as new powerful trends are just beginning. But we are now about to reap the rewards of 32 years of massive reform since 1974 in this country. We've whipped inflation. We've whipped Communism and Socialism. They are not dead, but obviously on the run. We've whipped myriad legions of productivity destroyers, and now to the victor go the spoils."

But for now Hays is charging again. Currently, it recommends an asset allocation for "long term growth" of 90 % in stocks, 10 % in cash.


Sound familiar? Sounds like 2000 to me. Sounds awfully confident. We all like confidence. It replaces the lack of confidence we may have. Then again, Mr. Market typically punishes confidence. The bullish advisors may be right and we may run to massive new highs on all indices over the next few years. Now, if we march to massive returns in the next few years, that would place some indices at even higher nose bleed levels than they are today. ie, Transports, metals, broker/dealers, small caps, etc. And, it would drive the PE on the S&P to well over twenty again. Maybe thirty. Could happen. Could be different this time. Could be my work is going to turn out to be totally worthless. I'm not being cynical. Well, ok, not that cynical. But, I could be wrong and this might not be a topping formation.

Don has stated in the aforementioned article that stocks are more cheaply valued than at any time in thirty years. Pssst! Don, where'd you get your data? The S&P, the only sanely valued index, is more than 3x more expensive than it was in the mid 1970s. I'm using facts. I'm not sure what you are using.

So, let's assume this bull thesis may be valid. If we are on our way to a brave new world, why is the innovation-laden Nasdaq acting so poorly? Forget about the mega cap weighted NDX which also contains many of the components driving the S&P. The innovation leaders which will lead us to that brave new world the bulls describe. (Oh, and I do agree has potential to come true long term.) Seems rather ironic that the Nasdaq advance/decline line cratered when the market cratered in May. Then, wouldn't it follow that the advance/decline line would rise from the ashes with this brave new world being described? But, in fact, it hasn't budged. So, how can that be? Mega caps, which disproportionately weight all major indices in the US are carrying the day while most stocks languish. Unless you are in a very narrow group of stocks, your portfolio still hasn't recovered to May levels. Is that a good thing? Well, I don't think Martha would say so. And, it coincides with people starting to do really piggish things in the market as I write this. My favorite sentiment indicator which measures what people do not what they say is once again quite negative on stocks. Tis a brave new world or tis topping action?

Well, I recall said advisor called three bottoms, raised cash near the bottom and now is 90% invested in stocks again. And that was all done in a period of a few months. Are we seeing a little of lesson #12 in the prior post? "#12 Most newsletters offer both sides regarding market direction. Whichever way the market goes will then be highlighted in subsequent newsletters as if the writer knew what was coming."

The bulls may be right. And, I do hope Don is right. I generally agree with his positive thesis of western democracy and America. And, I'd rather eat a gourmet meal than a sh*t sandwich as defined by the economy any day. But, I, for one, am not so confident.

posted by TimingLogic at 11:40 AM